Analysts Underestimate Facebook Ad Revenue Potential
Originally published May 2012
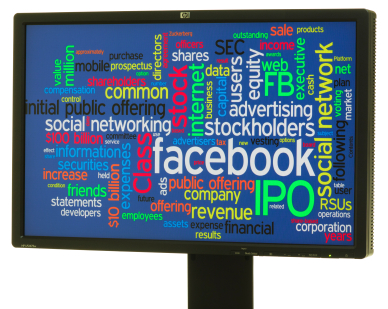
As public offering approaches, Facebook's ad model takes center stage.
As Facebook prepares for its public offering, due May 18 with opening share prices estimated by analysts at a range of $28 to $40, investors are focusing on the company's growth potential from advertising and marketing budgets. Some analysts have mistakenly focused on Facebook's historic dependence on traditional online display advertising, which has served as its core revenue center to date. However, Facebook is uniquely positioned to tap into multiple budgets that represent the fastest growing sectors of the marketing business. These include social marketing, social commerce, digital couponing, e-mail, social TV, word-of-mouth and conversational marketing, online video, mobile, social and promotional sponsorships, search marketing, social gaming, point-of-influence/GPS-based marketing, and interactive television. By 2020, Facebook will be positioned to capture a significant share of a $150 billion to $200 billion digital and social advertising and communications marketplace just in the U.S. Social marketing budgets alone are forecast to increase from $2.7 billion this year to $25.5 billion in 2020.
Our forecasts project online display advertising growth of only 7.3% average annually for from 2013 to 2015, and average annual declines of 1.4% from 2016 to 2020. Analysts focusing exclusively on these numbers would rightfully be concerned about Facebook's growth potential. The expanded marketing budgets that Facebook will be uniquely positioned to tap into are growing at exponentially faster rates.
An exclusive analysis by Jack Myers Media Business Report of the growth forecasts for these combined categories provides compelling and convincing data that Facebook will experience explosive revenue growth driving exponential increases in shareholder value. In addition to the categories identified below, it's not unreasonable to expect Facebook to invest in original Facebook digital audio and video content as those markets evolve and become more economically viable, tapping into television and radio budgets. Myers' full 2009-2020 Marketing & Advertising Investment Data and Forecast, with details on 56 media and marketing categories is available to subscribers at www.jackmyers.com.
| Jack Myers Media Business Report Economic Data | ||||||
| Digital Media Marketing/Advertising U.S. Spending 2012-2020 | ||||||
| Exclusive 2012-2020 Myers Marketing & Advertising Investment Data & Forecast | ||||||
| ($=000,000). | Average Annual Spending Growth | |||||
| 2012 $ | 2013-2015 | 2016-2020 | 2020 $ | |||
| Search Marketing (Online/Mobile) | $16,377 | 9.2% | 4.5% | $26,522 | ||
| Media Directed Social/Promotional Sponsorship | $13,109 | 8.8% | 6.6% | $23,220 | ||
| Online Originated Display Advertising | $7,233 | 7.3% | -1.4% | $8,297 | ||
| $3,602 | 9.3% | 0.8% | $4,882 | |||
| Digital Sales Promotion/Couponing | $3,541 | 38.3% | 22.0% | $25,234 | ||
| Social Marketing/WOM/Conversational | $2,688 | 46.7% | 25.0% | $25,519 | ||
| Videogame/Social Gaming | $1,813 | 21.3% | 9.6% | $5,102 | ||
| Mobile & Apps Advertising | $1,689 | 31.0% | 17.1% | $8,290 | ||
| Online Originated Video Content Adv. | $1,181 | 60.0% | 31.0% | $18,299 | ||
| Point-of-Influence/GPS-Based Mktg. | $838 | 8.6% | 11.0% | $1,798 | ||
| Interactive, VOD and Addressable TV | $119 | 110.0% | 56.0% | $9,652 | ||
| TOTAL Marketing Budgets | $52,190 | (2015 = $ 83,609) | $156,815 | |||
| SOURCE: Jack Myers Media Business Report | ||||||
| http://www.jackmyers.com/jack-myers-spending-forecast | ||||||

Jack Myers
With over five decades of experience in corporate leadership, B2B research, management insights, and technological trends, Jack Myers is a visionary leader and a trusted source for guidance and preparation as generative AI and machine intelligence dominates …