
Applying Media Quality Inside A Bespoke MMM: Six Tasks
Marketing mix models are bespoke. Two brands in the same category using the same MMM provider can end up with models that differ in channel taxonomy, geographic granularity, control variables, refresh cadence, and tolerance for added parameters. This flexibility makes MMM valuable to brands: the mix models are fitted to the business, and each one is unique.
At Adelaide we have found that our AU media quality data improves MMM output granularity and actionability, but the uniqueness of each MMM means each brand’s ability to apply AU within its particular MMM context can vary. (There are industry efforts underway to bring some standardization to MMM creation, from the IAB and CIMM.)
This article describes six AU-based tasks a brand can execute to answer business questions in the context of its bespoke MMM. Each task addresses a different strategic question. The tasks can inform and are informed by the brand’s MMM.
Six Tasks
All the tasks listed below make bespoke MMM outputs more actionable - and therefore more valuable - for media teams at brands and agencies:
Task A: Validate the MMM against AU, an external data source
Task B: Monitor AU media quality levels between MMM refreshes
Task C: Constrain the MMM’s scenario-planner with AU media quality thresholds
Task D: Use AU to reallocate inside a channel before shifting budget out
Task E: Assess MMM outputs based on AU-weighted impression inputs
Task F: Discover planning thresholds by splitting aggregated channel inputs into AU-scored groups
Why?
Source: Adelaide Metrics (illustrative)
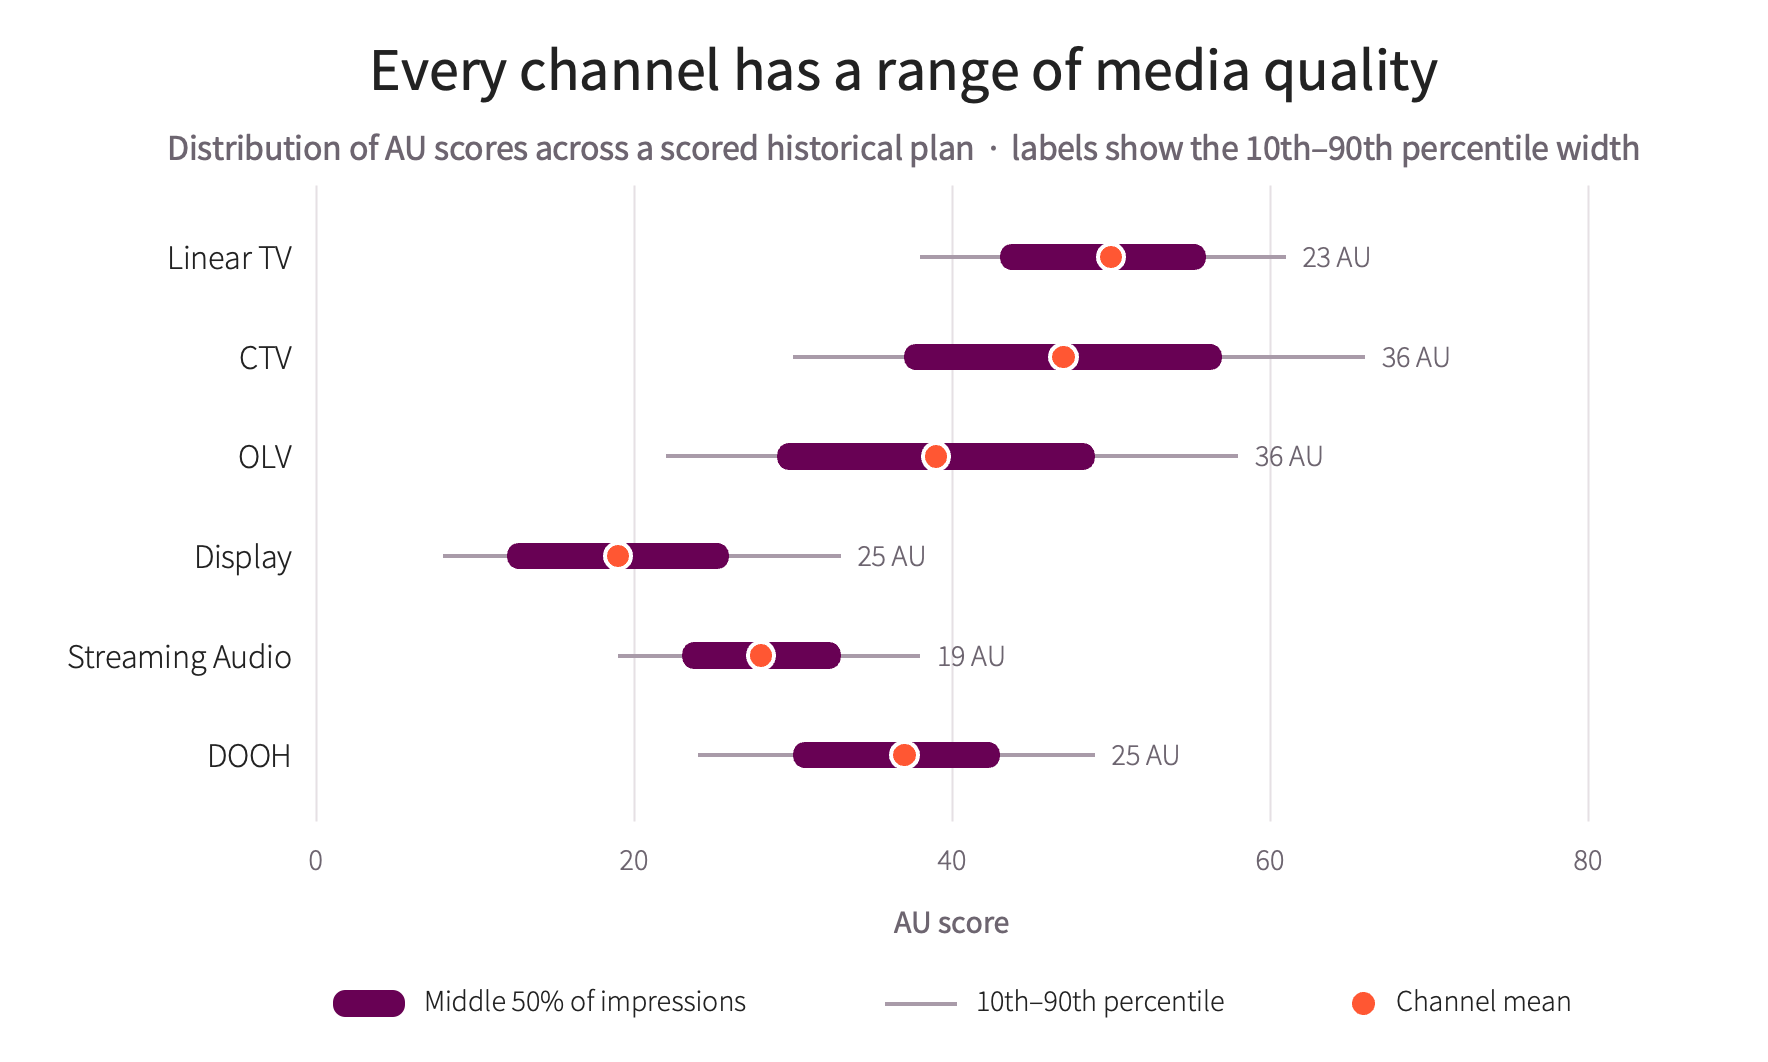
The chart above is the premise for all six tasks. An MMM usually reports media channel effects at an aggregate level. MMMs don’t typically report media channel effect ranges inside channel aggregates - but those ranges are critical. Analyzing them with AU data to understand an MMM’s ingoing media quality levels and the ensuing impact of those levels is the first step for all the tasks described below.
The tasks are ordered by the effort required to execute them, from the brand’s analytics and media teams and its MMM provider. Most brands end up carrying out several of the tasks on the list.
Two Caveats
Coverage: AU scoring depends on measurement access, which varies by channel and by publisher. Adelaide can typically score 90+% of media on a plan but coverage should be double-checked ahead of each MMM refresh cycle.
Unmeasured impressions: Document how unmeasured impressions will be treated. Options are: via an Adelaide channel norm, via the brand’s own measured average for that channel and partner, or via labeling unmeasured inventory as its own variable.
Task A. Validate The MMM Against AU, An External Data Source
MMMs are largely validated against themselves. Holdout error, coefficient stability and posterior checks are all useful, but each is downstream of the same data and the same assumptions used to produce the MMM in the first place. Independent corroboration of MMM findings is harder to come by. AU is built from completely different data inputs and trained on independently-produced outcomes data. MMM and AU inputs have no overlaps.
What the task answers: Do the MMM’s channel results agree with an external gauge of media quality?
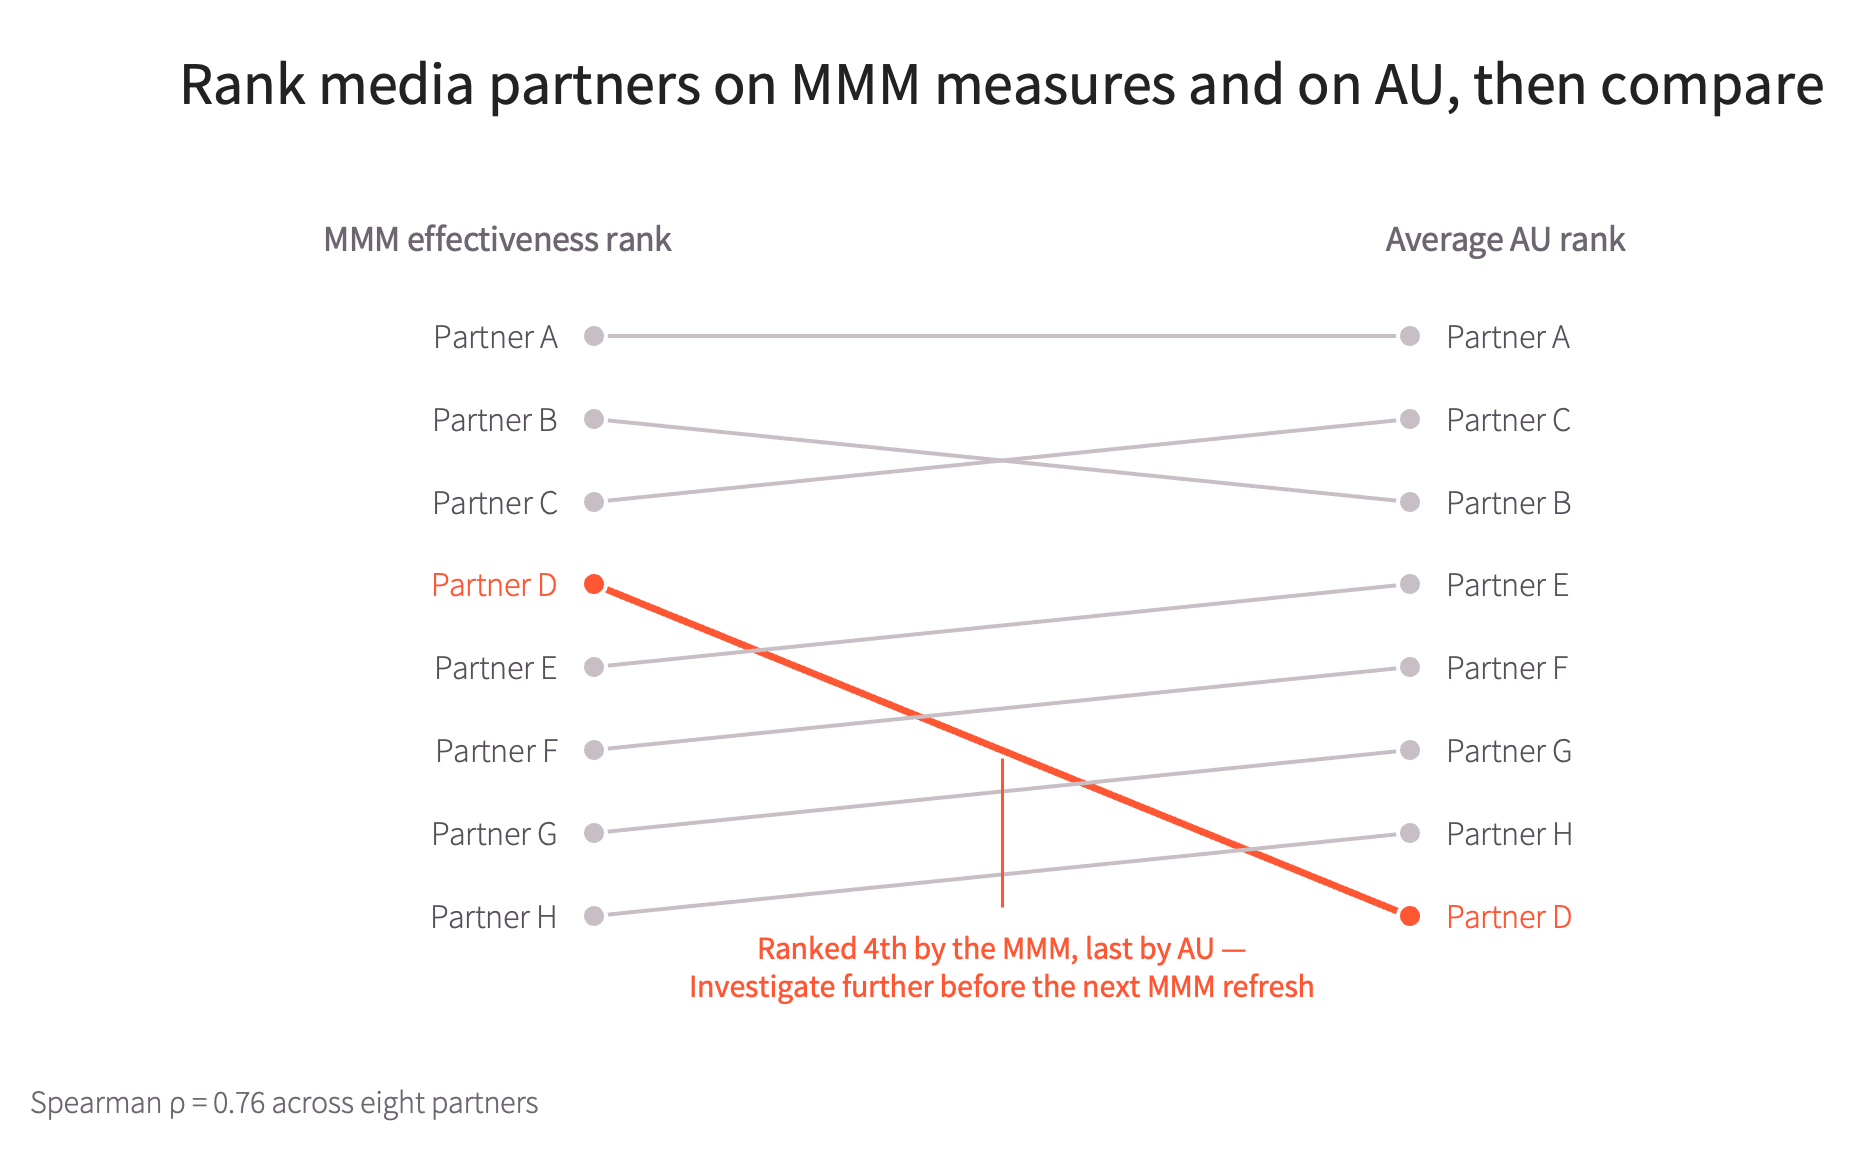
• Rank media channels and partners in an MMM against their effectiveness measure.
• Rank the same list of channels and partners by average AU.
• Compare the two lists and assess any differences in rank position.
Where the rank positions agree, the brand has outside confirmation of both sources’ validity. Where they disagree, the brand can treat that as a finding and look for a cause, which could be a channel the MMM cannot isolate, a gap in AU coverage, or a lower-level difference in media quality the MMM does not detect.
What’s needed: the MMM’s published channel or partner estimates, and AU scores for the same period.
Source: Adelaide Metrics (illustrative)
Task B. Monitor AU Media Quality Between MMM Refreshes
Media quality levels can go up or down between MMM refreshes: supply paths change, partners substitute placements, seasonal inventory changes. A channel can deliver the same impressions at the same cost and score lower on AU than it did when the MMM was built. So if a channel misses its expected effect, check media quality level changes on specific inventory first – it is the easiest data point to test and usually the easiest to correct, requiring just a partner conversation rather than a budget or plan change.
What the task answers: The MMM’s recommendations are a year old. Is the media being bought today still the media the MMM was fitted on?
• Track the average AU of each channel on an ongoing basis against that of the time period the MMM was fitted on.
• Set an AU threshold a few points below the fitted average.
• Treat a threshold breach as an alert to examine supply paths and partner mix.
This task can be executed as an ongoing monitor or as a spot test.
What’s needed: ongoing AU scoring and the MMM’s channel estimates.
Task C. Constrain The MMM’s Scenario-Planner With AU Media Quality Thresholds
Every MMM-provided scenario-planner tool assumes that the next impression in a channel will look like the average impression the MMM was fitted on, but that assumption is probably untrue. Since a brand probably already buys its most desired inventory, adding more inventory in a specific channel requires buying further down its own supply curve – so the scenario-planner’s projected effectiveness measure when adding budget to a channel is probably optimistic.
What the task answers: The MMM says to put another $2 million into CTV. Can the buying team execute that?
•Derive an AU threshold from the brand’s own outcome data: join AU-scored exposures to media the brand already tracks, exclude media below a threshold step by step, and re-measure the outcome variable at each step. Where the outcome performance measure inflects is the media quality threshold.
• Run the same analysis separately per outcome variable per media channel – a display threshold and a CTV threshold are not comparable.
• Then add the media quality threshold values into the scenario-planner’s constraint settings.
Thus constrained, the scenario-planner output can be “another $2 million into CTV at or above 44 AU,” an instruction which can go on an insertion order or into a PMP deal term or programmatic bidding rule.
What’s needed: AU-scored exposures joined to outcome data, a rolling-threshold analysis, and the MMM scenario-planner output.
Task D. Use AU To Reallocate Inside A Channel Before Shifting Budget Out
Before acting on channel budget-reduction recommendations, dissect that channel’s delivery by AU levels and assess the brand’s outcome variable performance data within the channel rather than against other channels. If the high point of the channel range performs well on outcome effects but the bottom of the range does not, the budget recommendation can become “reallocate placements in this channel” instead of “spend less in this channel.”
What the task answers: The MMM says to cut display. Does it mean cut all display, or just cut the lowest-quality display?
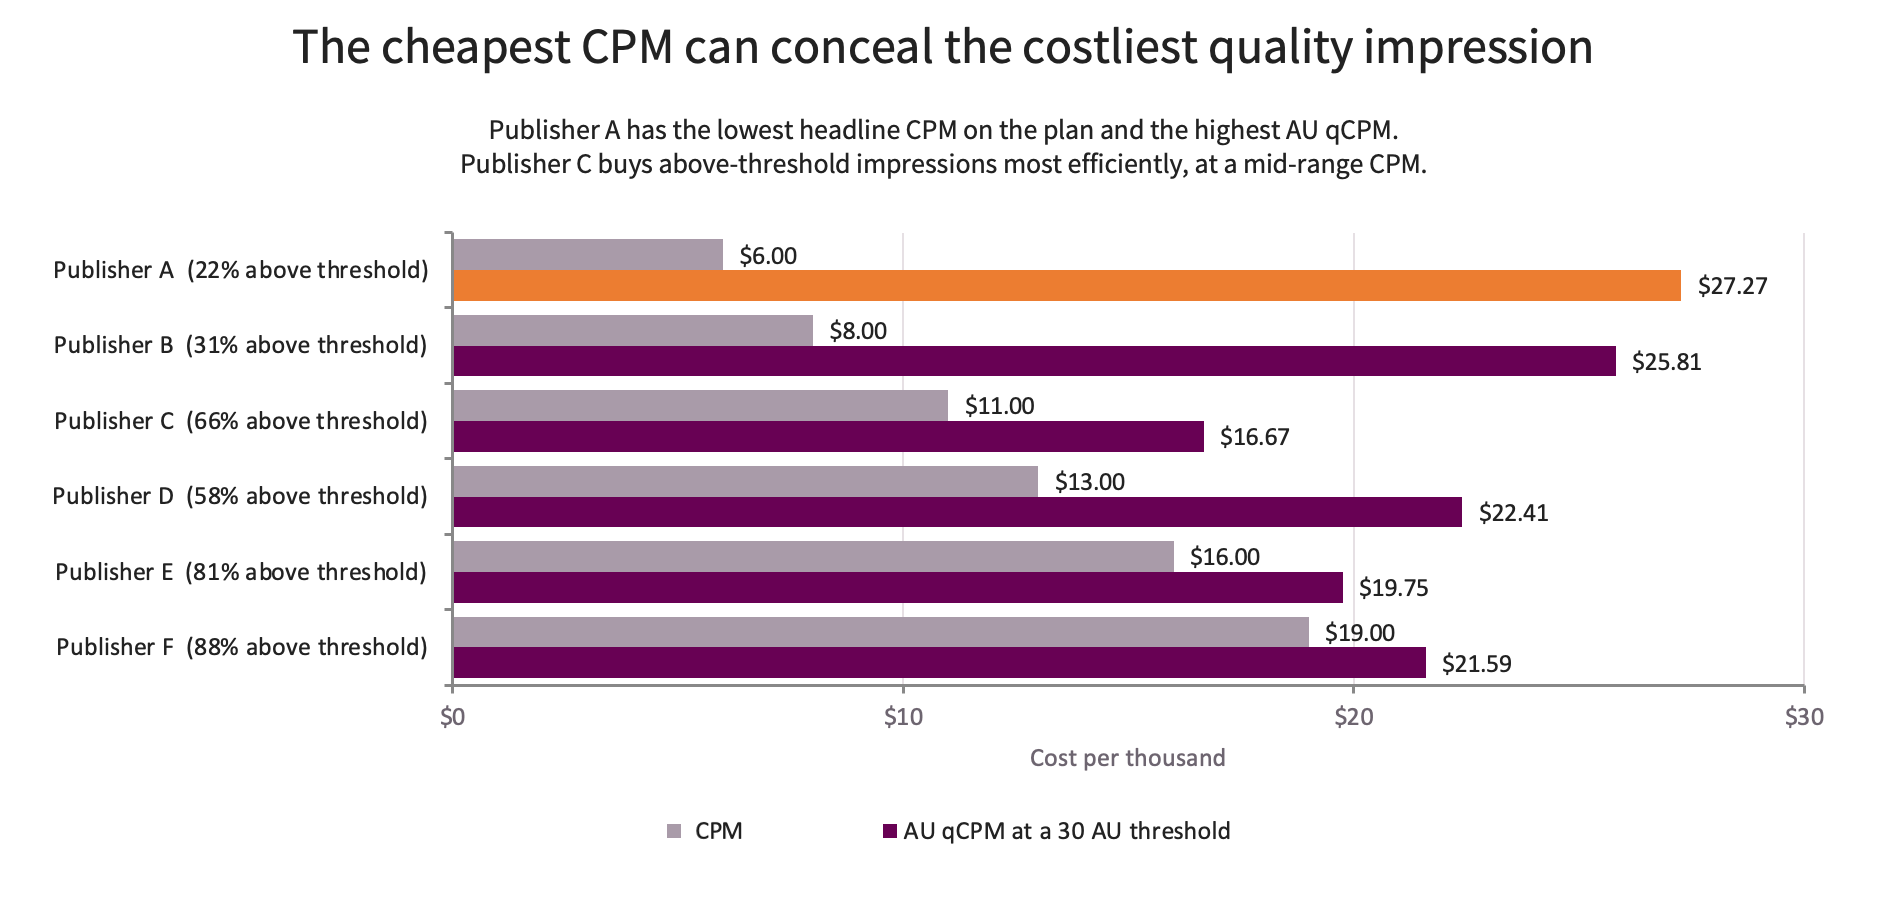
○ Identify high-quality placements with AU qCPM – the cost divided by impressions at or above the AU threshold, per thousand.
○ A publisher with a $6 CPM delivering 22% of its impressions above the AU threshold produces an AU qCPM of $27.27; a publisher with an $11 CPM delivering 66% above the AU threshold produces an AU qCPM of $16.67.
○ The cheaper CPM media is the more costly source of high-quality impressions.
This task needs the AU threshold definition from Task C or Task F. It’s the quickest of the six tasks to execute because the analysis can be done for a single channel by a single team.
What’s needed: AU scores, media cost data, the MMM’s channel verdict, and a threshold from Task C or Task F.
Source: Adelaide Metrics (illustrative)
Task E. Assess MMM Outputs Based On AU-Weighted Impression Inputs
An impressions-based MMM reports the impact of every impression as the same, so channels that produce cheap reach look productive in proportion to volume, and total media contribution to sales is reported well above a spend-based model output. Quality-weighting media impression inputs with AU scores can help. Weighted inputs are already compatible with most major open-source MMM platforms.
What the task answers: Why does the MMM attribute so much of the outcome to the least expensive channels?
• Weight each impression by its AU score before loading it into the MMM, then re-run the analysis.
• Compare the AU-weighted analysis findings against the unweighted analysis findings on three dimensions: holdout fit, coefficient stability across refreshes, and whether total media contribution to sales is more plausible when considered against the brand’s spend-based benchmark.
What’s needed: an MMM provider, one revised input file, one additional MMM run.
Task F. Discover Planning Thresholds By Splitting Aggregated Channel Inputs Into AU-Scored Groups
A media quality threshold established from outcome data is the strongest input available. Brand lift studies, conversion data joined to AU-scored exposures, and pooled results across campaigns all produce a defensible AU minimum tied to a named KPI.
When data is missing because studies were not run, outcome data does not join cleanly, or the brand is new to media quality measurement, the MMM itself can produce the media quality threshold.
What the task answers: With no outcome study to draw on, can the MMM itself produce a planning threshold?
• Bin media impression volume by quality.
○ Divide each channel’s impressions into three or four non-overlapping AU bands, for example 0 to 30, 30 to 45, 45 to 60, and 60 and above.
○ Every impression falls into exactly one band. The bands still sum to the channel’s original volume, so nothing is added to or removed from the MMM media data inputs.
• Load the bin impression volumes as separate model inputs.
○ Each band becomes its own media variable, carrying its own coefficient, carryover term and response curve. The MMM’s structure is otherwise unchanged.
• Measure the effect each bin contributes.
○ Observe effectiveness changes as media quality rises. The point at which the coefficients step upward is the brand’s threshold, derived from its own business outcome.
○ The check that the exercise worked is that the bands rank-order with AU.
• Weight and consolidate the bins according to what the MMM reported.
○ Bands that perform alike should be combined. Bands that perform differently should carry the weights the MMM assigned rather than an assumed scale.
○ This step converts a diagnostic into new tools for a planner: a threshold, a quality-adjusted CPM.
What’s needed: AU scores on the channel’s impressions, an MMM provider, a change to the MMM specification, and a refresh window. The most involved task on the list.
All six tasks listed above refer to the same premise stated in the beginning: brands can obtain more output granularity and, critically, more business applicability and actionability by using AU to disaggregate the media averages their MMMs are likely reporting. Adding AU to a bespoke MMM is a great step for a brand seeking new ways to get value and business intelligence out of its MMM investment.
Co-authored with Ben Lowe, Adelaide Senior Director, Client Strategy & Insights
Posted at MediaVillage through the Thought Leadership self-publishing platform.
Click the social buttons to share this story with colleagues and friends.
The opinions expressed here are the author's views and do not necessarily represent the views of MediaVillage.org/MyersBizNet.

Claire Browne
Claire joined Adelaide in 2024 after 16 years as VP/Director of Media Research at RPA, a large independent full-service agency. Clients included American Honda Motor Company, La-Z-Boy Furniture Galleries, CoStar Group, and ARCO Gas. Prior experience in media…