C3 Should Have Advertisers C-ing Red - Alex Petrilli-TiVo

Nielsen found itself in a heap of trouble last week when they disclosed to clients a major snafu with their NPower program that generates reach, frequency and GRPs based on C3. Nielsen said the issue affected data for all of 2011
.At least we can be assured the C3 issue will be resolved soon. From a USA Todayarticle, Brill said the new ratings are only a "baby step" in the direction of measuring actual commercial viewership. That's because C3 rates the average viewers during all commercial minutes of a program, not for specific commercials. She wants Nielsen to deliver by-the-second ratings.
Unfortunately that article is from October 2007. That means Nielsen's C3 is the only four year old still taking baby steps. It is time the industry sought another alternative. A system not based on minute-by-minute ratings. One that is not an average of all commercial minutes in a program when the reality is the current by the minute metric is muddied with program content, PSAs and promos. Second-by-second spot evaluation is the only accurate metric that an advertiser should be utilizing. And don't just take my word for it.
From the New York Times: Alan Wurtzel, the president for research at NBC, said in a telephone interview that the results from premiere week "prove we need a better way to evaluate our performance." Mr. Wurtzel made that statement in October of 2008
From last week's MediaPost.com: In a bid to minimize commercial zapping, broadcasters are likely to lead pods with catchy ads for a new tablet, followed by a movie premiere ad, Leary argues. There is nothing sexy about ads for toilet paper and high cholesterol medications or spots for other prosaic essentials, which "are likely to get buried in the middle -- and less effective -- portion of the break," Leary states.
The current system penalizes the toilet paper ads but continues to charge them the going spot rate. Utilizing TiVo's Stop||Watch data we consistently see that spots in the middle of the pod experience significantly less commercial retention than spots that fall in the first or last pod position. And only 13% of all spots fall in the first pod position (Apr-Jun 2011 average) while that figure falls to 10% when evaluating primetime.
It has been four years and Nielsen has not found a better way to evaluate commercial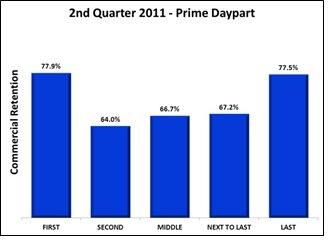 performance, still basing results on their minute-by-minute data. TiVo's Stop||Watch service improves that by a factor of sixty, offering second-by-second detail with up to seven days of time-shifting. Our data, which is representative of U.S. DVR households, offers spot level detail for over seventy networks.

Alex Petrilli
Alex Petrilli serves as senior manager of media insights at TiVo. In this role, Alex is responsible for utilizing the vast data resources available at TiVo to convey valuable information about the television industry and viewing trends. Prior to TiVo Alex wo…