Color By Numbers -- A Valuation Framework for the Ad Tech Sector -- Terence Kawaja

Terence Kawaja is Founder and CEO, LUMA Partners
This past summer, trade press commentary focused on the impending doom of the Ad Tech space, pointing to the industry’s fragmentation and noting the underperformance of recent IPOs: Millennial Media (MM), Tremor Video (TRMR) and YuMe (YUME).
The tides quickly shifted in the fall when Rocket Fuel (FUEL) went public and finished up nearly 100% on its first day of trading. The following month, Criteo (CRTO) also had a successful IPO and, along with Rocket Fuel, trades at higher multiples than the first batch of deals with a market cap well north of a billion dollars. In addition, two high-growth private companies were acquired (Adap.TV by AOL and MoPub by Twitter) at more favorable multiples.
These positive events led to a swift change in industry sentiment, though we believe the comparative disparity in multiples has created a lack of understanding of relative valuations.
From a fundamentals perspective, the Ad Tech sector overall has rarely seen better times. The ongoing shift of consumers’ time and marketing spend to digital channels has continued unabated at a 20%+ annual pace. The more data-driven and programmatic ad spend is experiencing much faster growth — IDC estimates a 75% CAGR from 2010 to 2017. This growth has disproportionately benefited the large platform players like Google (GOOG), Facebook (FB) and Twitter (TWTR), which has been reflected in their recent superlative stock performance. We are optimistic that new platforms and formats will add to this already torrential growth rate.
This rapid growth, coupled with a relative dearth of consolidation and, until recently, limited public market access, has resulted in a large group of scaled private companies. We estimate that the Top 20 private companies average over $300 million of media spend (or gross revenue) and have a median growth rate of 60%. That’s a lot of companies at scale and growing rapidly!
Given that at least a dozen of these companies are contemplating IPOs in 2014 and 2015, we want to share a framework for how we believe the market values this sector. This paradigm is not a prescriptive scientific formula, but rather a suggested framework to understand the way public markets look at investments in Ad Tech. We would also point out that this framework applies to scaled companies capable of accessing the public markets and does not necessarily translate to smaller players.
To assess public market valuations, it is helpful to take the investor’s perspective. Regardless of the industry, investors tend to focus on three parameters:
• Growth (which encompasses the total addressable market).
• Operating leverage (the ability to grow revenues at a faster pace than expenses).
• Predictability (which encompass revenue certainty and defensibility).
We could add a fourth parameter — strategic value — that in some cases captures potential takeover premium. Note that predictability materially improves as ad spend moves along the performance curve and is considered more of a cost-of-goods-sold than a discretionary expense. In search advertising, for example, marketers usually buy keywords all the way to the efficient frontier due to the tight connection to performance (sales). Display is not quite there but moving in that direction.
Below we have plotted the six public display Ad Tech companies by forward revenue growth and valuation multiple based on current trading levels and consensus estimates. Note that we are using “Net Revenue,” which excludes media costs, in all cases that allow for the comparison of these different business models. We added some public software-as-a-service (SaaS) companies for comparative purposes even though most companies intermediating ad sales do not employ SaaS models.
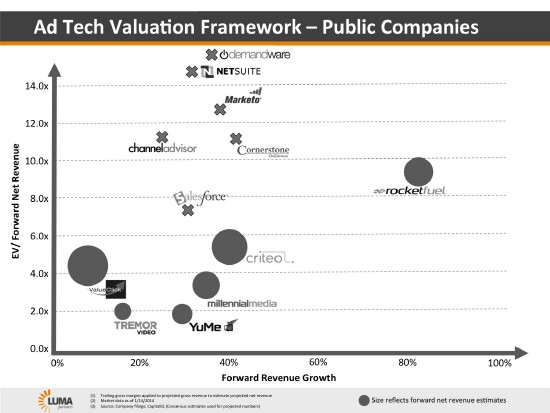
One would obviously expect valuation multiples to be positively correlated with growth, as well as business models that apply more leveraged technology relative to media. It’s a spectrum.
So far, this is all observed fact — black-and-white, if you will.
To better understand the significant variances in valuation shown above, we group the companies into four primary categories: Network 1.0, Network 2.0, Programmatic, and SaaS. Note that while some companies have traits of one category, many have hybrid business lines that span categories.
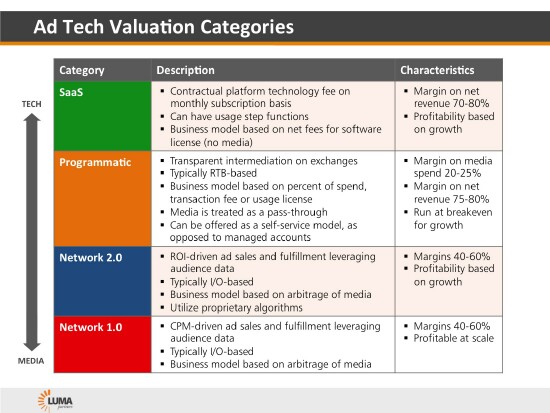
Network 1.0 businesses have campaign-based models serving as middlemen between advertisers and publishers and earn profits from the spread between media bought vs. sold. Network 2.0 companies have similar business models, though they typically source media from exchanges (rather than direct relationships with publishers) and possess more proprietary technology that provides greater performance for the marketer. This superior performance, as well as the focus on the higher-growth customer-acquisition segment of the market, has resulted in higher revenue growth for these companies.
Programmatic businesses typically have a media pass-through model, charging a technology fee based on the amount of media dollars managed by their systems. For these Programmatic companies, the margin on media spend is around half that of the Network companies, but when looked at on a Net Revenue basis, have higher margins more typical of software models. Finally, SaaS refers to companies with contractually recurring monthly software fees with no regard to media, which is the most predictable model of the four categories. In Ad Tech, these could be companies providing data management or analytics capabilities as opposed to media intermediation.
Now we apply some color — the four categories with corresponding valuation vectors. As stated at the outset, this is not a strict formula but rather a framework to provide valuation context. You can see where the public companies trade with respect to these valuation vectors:
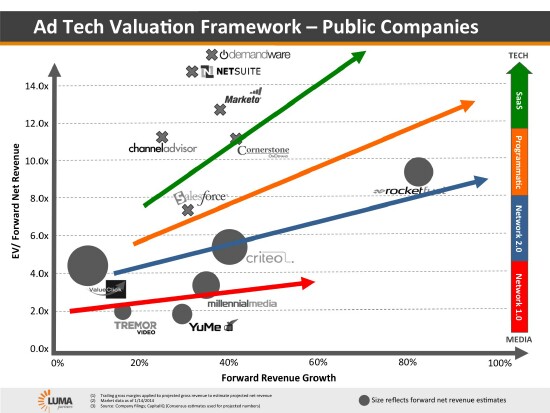
We believe the market values Network 2.0 businesses at a premium to Network 1.0 businesses, and the SaaS businesses trade even higher. We believe the market will value Programmatic companies higher than Network 2.0 (again, on a net revenue basis) due to their greater operating leverage and higher predictability of revenues. Note that the vectors associated with higher technology categories have greater slopes, reflecting their higher operating leverage.
Companies that are perceived by the market to be in a particular category can potentially use M&A to improve their position. For example, ValueClick’s (VCLK) acquisition of Dotomi (a comparable of Criteo) improved their positioning and Millennial Media’s recent acquisition of JumpTap also elevated their valuation.
Speaking of M&A, we litmus-tested the Color by Numbers framework on the relevant scaled M&A transactions and believe it holds up (see the link to the presentation on SlideShare below). We also plotted the B2C digital giants against the vectors. Yahoo ex-Asian investments is trading at around 3x net revenue, AOL that has multiple business models from access to content to programmatic trades closer to 6x net revenue and Google, again with multiple businesses, trades even higher at over 8x revenues. And the more nascent companies, Facebook and Twitter are off the page.
We are likely to see several Programmatic companies pursue the public market over the next 24 months. Not all candidates have pure-play models. The market will need to assess each of these business models and the companies’ respective roles in the ecosystem in order to determine their appropriate valuations. We hope this Color by Numbers framework is a helpful start.
To access a SlideShare presentation and download the Color by Numbers slides, click here.
This article appeared first on Re/code.
Disclosure: LUMA Securities, a wholly-owned subsidiary of LUMA Partners, acted as co-managing underwriter for Rocket Fuel and may pursue underwriting or other advisory assignments with companies mentioned in this report or in the sector in general.
Terence Kawaja is Founder and CEO of LUMA Partners, a strategic advisory firm focused at the intersection of media and technology. He is a seasoned investment banker with more than 20 years of experience and has advised on over $300 billion of transactions.
Follow Terence on Twitter at @tkawaja
Check us out on Facebook at MediaBizBloggers.com
Follow our Twitter updates at @MediaBizBlogger
The opinions and points of view expressed in this commentary are exclusively the views of the author and do not necessarily represent the views of MediaBizBloggers.com management or associated bloggers. MediaBizBloggers is an open thought leadership platform and readers may share their comments and opinions in response to all commentaries.

Terence Kawaja
CEO LUMA Partners Terence Kawaja is Founder and CEO of LUMA Partners, a strategic advisory firm focused at the intersection of media and technology. He is a seasoned investment banker with more than 20 years of experience and has advised on over $300 bil…