Dynamics of Attention: From Theory to Fact -- Barbara Alpert

In a previous paper outlining the components of our metrics, the Dynamics of Attention, we noted the inextricable link between time and attention and the context we have found to be critical: the flow of attention. This reflects the fact that every communication has a personality and pace and must grab people, stimulate their interest and keep them engaged. One measure of success is whether the peaks and valleys of attention are in harmony with the ebb and flow that was baked in, as measured by the Direction, Magnitude and Momentum of slider moves and the Duration of steady periods between them.
Here we share some results of our work, using two commercials of equal length, different in every other way. Their attention stories are as distinct as their substance and styles. Door No. 1: a commercial introducing a women’s health product. Reaction to a bold creative approach was the focus of this test with a female sample. Door No. 2: an animated spot for a consumer product using vignettes, shown to an international, gen pop sample to determine reactions across key markets. Our discussion is not about comparing creative alternatives. Rather, it highlights the sensitivity of [ReSync]™ attention algorithms to the rhythms and messaging of varied content.
Overall Attentive Reach
Overall Attentive Reach, measured by moving the slider at least once, demonstrates the appeal of the health product, where 93% of testers were attentive. The consumer product grabbed the attention of 80% of its sample.
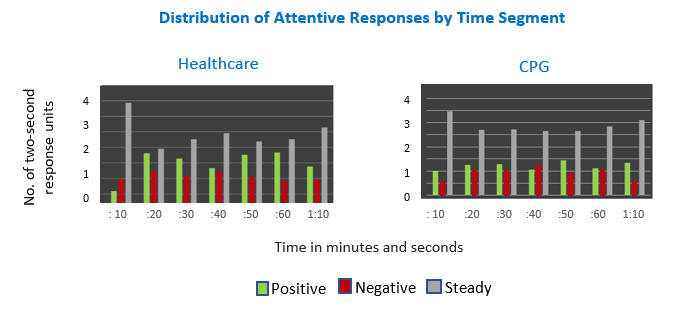
Attentive Responses
We examined the number of moves in each direction by segment, then added the important element of steady viewing, when the previous move is held. These spans of action and maintenance depict engagement within each segment. The healthcare commercial engendered more activity while the CPG response was more even, with longer steady periods. As steady mode does not overtly signal positive or negative attitude, it warrants more unpacking. We are analyzing the actions that preceded and followed holds and calculating the distribution of combinations of positivity, negativity and continuity. We also can see the magnitude of the positive and negative attentive moves by segment. The healthcare product elicited both more extreme negative and positive attention. The least intense pattern occurred in the last segment. A different story plays out in the more even response to the CPG commercial, where the magnitude of moves was more contained. The strongest positive attention occurred in the last segment, against the second lowest negative.
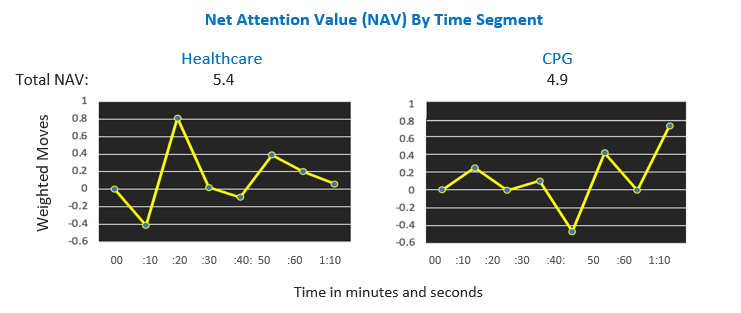
Momentum
The momentum of the commercials showed different attention flow patterns. Net Attention Value (NAV) weights the number of attentive moves by their magnitude, taking account of both the length and direction of each move on the numeric scale. NAV does not give a value to the steady periods. An unpromising start in the healthcare spot led to a great spike, but negative direction prevailed, save one additional recovery. In the CPG vignette commercial attention patterns varied from segment to segment -- with one significant negative instance -- but ended on an up note.
The opinions expressed here are the author's views and do not necessarily represent the views of MediaVillage.com/MyersBizNet.

Barbara Alpert
Barbara Alpert is Co-founder and President of Chilmark Digital, a software development and data company that helps clients understand and better communicate with customers, audiences and stakeholders. Clients for its [ReSync]™ insights platform include…