The Reality of Broadcast Television - Alex Petrilli-TiVo

With the broadcast upfronts one month away, it is time for those in the business of television to face the facts – and, as with most reality television, the facts are not pretty. For the past few years, television transactions have gone on relatively unfettered despite these gory details describing the actual broadcast environment:
· C3 was adopted four years ago as the new television metric,
· Technology in the home has continued to evolve, and
· Media consumption patterns have continued to evolve during that timeframe in ways that one could argue have made C3 obsolete.
Let's look at various viewing options over the last few years.
Changing ChannelsIn 2008, according to Nielsen, the average TV household received 130.1 channels. Today, a midrange DirecTV package includes 225+ channels. Is the C3 metric and the Nielsen sample size equipped to handle this increased fragmentation?
Tablet Time In April of 2010 the first iPad was released and second screen viewing began to accelerate at a rapid pace. In fact, according to a recent study commissioned by Viacom, tablets have surpassed computers for full length TV show viewing and now account for 15% of all viewing. The industry doesn't currently have a viable way to measure data for second screen viewing so where is it going to come from in the future? Nielsen's cross-platform measurement plan cuts their NTI sample in half leaving approximately ten thousand homes to interpret what is occurring on the second screen, hardly a robust sample size.
DVR Domination And then there's the DVR: According to a number of research studies, DVR penetration has more than doubled since 2007, going from 22% to over 45% today. The C3 metric was produced in an attempt to assuage the affect DVRs had on viewing in the home. C3 measures average viewership during the specific times when commercials are aired on a minute-by-minute basis. There are a couple of flaws in this formula, the most prevalent of which is minute-by-minute analysis. If a commercial break during Modern Family begins at 9:14:46, as I understand it, 9:14 is included in the C3 calculation. Bucketing this way can cause data which doesn't paint the real picture of viewing. Let me show you what I mean.
At TiVo, our Stop||Watch rating service tracks viewing on a second-by-second basis and when analyzing a top rated show such as Modern Family, the time-shifted ratings in DVR homes can drop as much as 60% over a 14-second interval in the moments after a commercial break begins. 60%! Including those 46 seconds into the C3 calculation inflates the viewership levels for almost half of all U.S. homes. There are other factors that further complicate the equation – pod busters, commercial-program integrated spots, network promos, etc. – none of which were contemplated in the construction of the C3 metric.
While Modern Family is a top-rated program, there is a similar story for most first run broadcast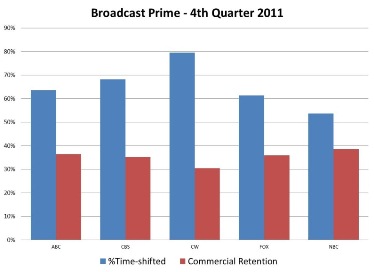 and cable prime. The table on the right shows the percent time-shifted and Commercial Retention – the ratio of average-second viewing of the selected commercial broadcast in a time-shifted mode to average-second viewing of the selected program in a time-shifted mode (for example, a 1.8 T-S commercial rating / 3.0 T-S program rating = 60% Commercial Retention) – for the five broadcast networks during the fourth quarter of 2011, according to Stop||Watch. As you can see time-shifted Commercial Retention, when analyzed on a second-by-second basis, is alarmingly low.
With a minute-by-minute currency of twenty thousand homes, the validity of the C3 metric carries the weight of 114 million households. That's a tough order for any sample, factoring in all the ancillary variables that cloud the data and ignoring the evolving methods of delivery further detracts from C3's ostensible chosen mission: measuring the performance of television advertising in a complex, ever-evolving environment.
Set-top box data does not have all the answers – not yet anyway – but it does offer a more robust and detailed picture of a brand's advertising performance than does the current currency.
The opinions and points of view expressed in this commentary are exclusively the views of the author and do not necessarily represent the views of MediaBizBloggers.com management or associated bloggers. MediaBizBloggers is an open thought leadership platform and readers may share their comments and opinions in response to all commentaries.
Alex Petrilli
Alex Petrilli serves as senior manager of media insights at TiVo. In this role, Alex is responsible for utilizing the vast data resources available at TiVo to convey valuable information about the television industry and viewing trends. Prior to TiVo Alex wo…