2020 Economic Forecast: Two Decades of Marketing Transformation
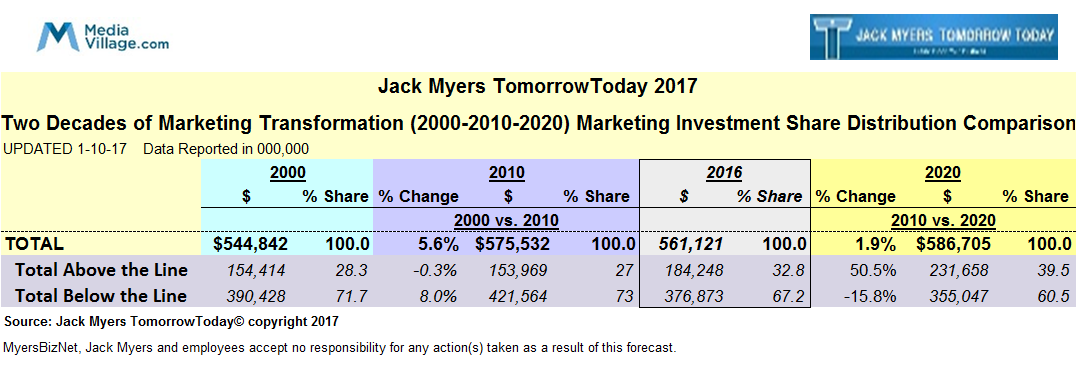
Between 2000 and 2020, total U.S. marketing communications investments will have grown a scant 1.9% from $544.8 billion to $586.7 billion, according to a new economic report issued today on 28 above and below-the-line media and marketing categories by MyersBizNet. (The full report is available to MyersBizNet paid member companies at www.mediavillage.com.) During the two-decade span, above-the-line media (aka “advertising”) is projected to increase its share of total marketing investments from 28% to nearly 40%, with virtually all growth resulting from a shift of below-the-line budgets (aka “shopper marketing” or “promotion”), which are projected to decline almost 16% from $390.4 billion in 2000 to $355 billion in 2020 (SEE CHART BELOW). During that same period, media advertising budgets are projected by MyersBizNet to increase more than 50% from $154 billion to $232 billion. The MyersBizNet report (download it below) includes 2020/2010/2020 data and forecasts for both legacy/linear and digital investments in 28 media and marketing categories. A separate MyersBizNet economic report projecting 2017 and 2018 marketing and media investments by category is also available to paid subscribers here.
In 2009, Jeff Zucker, then head of NBC Universal and now president of CNN Worldwide, famously warned the media industry that it was in danger of “trading analog dollars for digital pennies." Digital ad spending has grown exponentially since then from $39 billion in 2010 to $128.6 billion in 2016. During that same period, analog dollars (which we refer to now as “legacy/linear’) budgets have declined $90.4 billion from $432.5 billion to $342.1 billion Advertiser investments in broadcast network television digital media have increased from $750 million in 2010 to $2.5 billion in 2016, and are forecast by MyersBizNet to grow to $5.6 billion in 2020, representing nearly 25% of total broadcast network ad revenues and more than replacing a nearly 5% decline in linear broadcast network ad spending during that period. Comparable data is available in the MyersBizNet report on all 28 media and marketing categories.
THE FULL MYERSBIZNET 2000-2010 AND 2016-2018 ECONOMIC DATA AND FORECAST REPORTS ARE AVAILABLE FOR DOWNLOAD BELOW BY ALL MEDIAVILLAGE SUBSCRIBERS AT MYERSBIZNET PAID MEMBER COMPANIES. TO INQUIRE ABOUT YOUR MEMBER STATUS OR TO OBTAIN YOUR MEMBER ACCESS PASSWORD, E-MAIL maryann@mediavillage.com. FOR MEMBERSHIP DETAILS AND FURTHER DATA INSIGHTS, CONTACT JACK MYERS AT jack@mediavillage.com.

Jack Myers
With over five decades of experience in corporate leadership, B2B research, management insights, and technological trends, Jack Myers is a visionary leader and a trusted source for guidance and preparation as generative AI and machine intelligence dominates …