Impact of COVID-19 on National Video Advertising - SMI Economic Data

It's clear that we are witnessing unprecedented times due to COVID-19. Broadcast and Cable TV has been disrupted by the lack of professional sports, and the heightened interest in news programming. Sheltering has had major impact, both positive and negative, on consumer behavior and specific advertising categories. Some consumer packaged goods categories have seen increases in sales; major categories like travel and movies have been massively impacted.
SMI has previously released overviews of the initial impact of COVID-19 with their reports covering March 2020 and April 2020. Those reports highlighted a 15% decline in national TV revenues in March, followed by a 27% decline in April as the fuller effect of COVID-19 was felt by the market. The cancellations of major sports led to a 60% decline in ad revenues in sports programming in March, followed by a 72% decline in April.
This report attempts to dig more deeply into the March and April SMI data, and understand the trends for Upfront and cable, by program genre, and by advertising category. In addition, this report also attempts to evaluate spending patterns for digital video and social.
In addition to looking at actual spending changes between March/April 2019 and March/April 2020, this report also looks at SMI's forecast for March/April 2020 had COVID-19 not happened. It's important to remember that the national TV marketplace was receding slightly earlier in 2020. The combination of broadcast, cable and syndication was down 1.1% in January/February 2020 compared to the year prior. This was driven by a 4% increase for broadcast, a 2% increase for syndication and 5% decline for cable.
Key Findings:
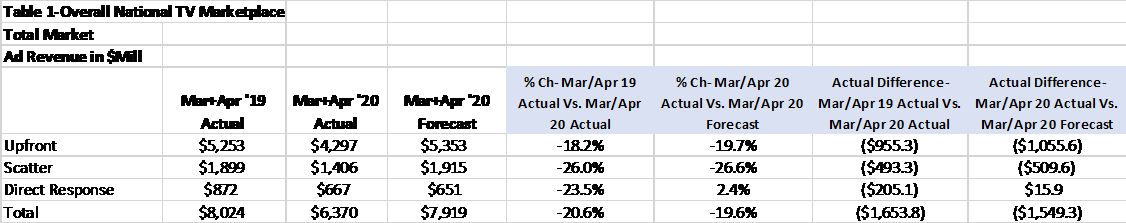
Across all national TV, the market was down over $1.6 billion from March/April 2019, and down over $1.5 billion from SMI's March/April 2020 forecast (see Table 1). Because COVID-19 hit during the latter part of the quarter, the declines were moderately greater for scatter versus upfront. As expected, the rate of decline picked up in April- upfront spending was down 25% in April compared to 13% in March; scatter spending was down 36% in April compared to 17% in March; direct response's decline moderated a bit, moving from a decline of 28% in March to an 18% decline in April. In total, national TV is down 21% from March/April 2019 actual spending and 20% for SMI's forecast.
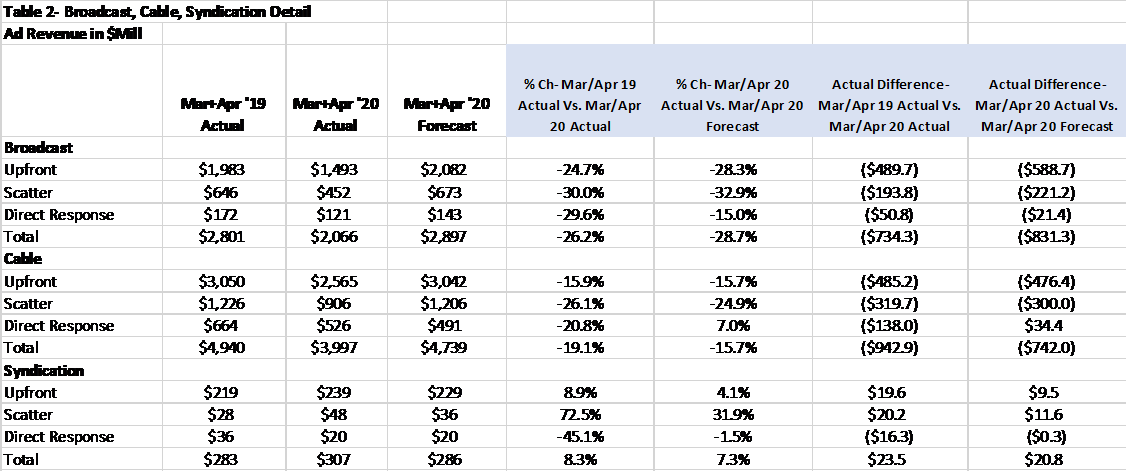
Because of the lack of sports programming, broadcast actually witnessed greater declines for both Upfront and scatter spending than cable (see Table 2), especially for Upfront spending. And the greater decline for broadcast is a reverse of January/February, leading to broadcast being down $700 million from last year and $800 million from forecast. Cable is down $900 million from last year, but only $700 million from forecast. Syndication is actually outperforming both March/April 2019 and SMI's March/April 2020 Forecast.
The state of April 2020 Upfront and scatter may provide some indication of the way that the national TV market may perform over the next few months until the economic impact of the pandemic recedes. Total Upfront spending was down 25% in April, with Broadcast down 32% and Cable down 22%. Total scatter spending was 36%, with Broadcast down 39% and Cable down 37%.
As previously mentioned, COVID-19 has materially changed consumer video consumption, with the heightened interest in news and shift of viewing time away from professional sports.
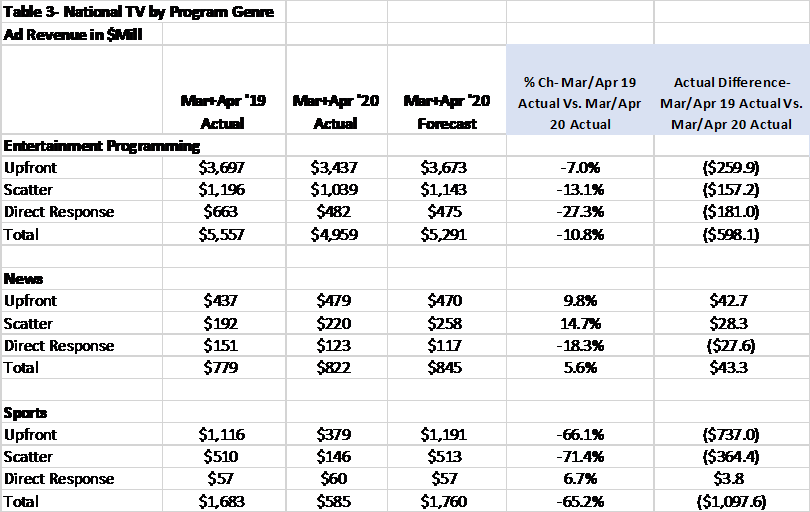
SMI is estimating that there was over a $1.1 billion shortfall in sports ad revenue across March and April (see Table 3), with approximately 2/3rds of that different due to upfront and 1/3rd due to scatter.
Overall, the news programming genre is performing well for both Upfront and scatter compared to March/April 2019. Some of the difference versus forecast may be due to companies like WarnerMedia reallocating sports dollars to news.
In spite of having more available GRPs due to higher ratings, the entertainment genre is down compared March/April 2019, depressed because of the overall market decline. As SMI has shown in their standard release, advertising in Entertainment programming, as a share of total, has grown.
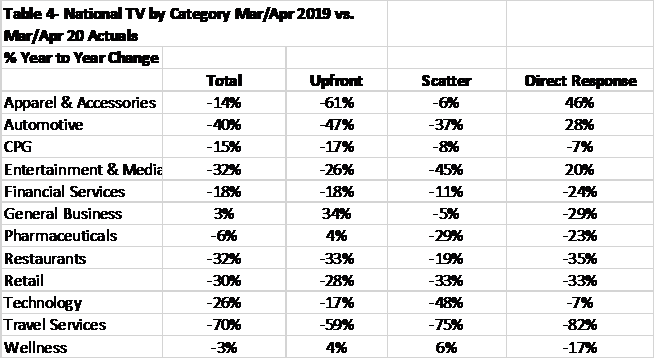
COVID-19 has had a major impact on some of the largest advertising categories, both in terms of how they were managing their upfront spending and upfront commitments, their scatter spend, and their direct response spend. Automotive and Entertainment & Media had double digit declines in upfront and scatter, while increasing their direct response spending (see Table 4). Restaurants, Technology and Travel Services all had double digit declines across all national TV buy types. Entertainment & Media (-45%), Technology (-48%) and Travel Services (-75%) had massive declines in scatter, accounting for over 50%, or $260 million, of the scatter decline.
There are some categories that either maintained or grew their ad budgets in March/April. The General Business category saw double-digit growth for upfront with a slight reduction for scatter. Pharma's Upfront spend increased slightly, but also had reductions for scatter.
Aside from national TV, SMI has line of sight to ad spending on digital video and social. There is interest in the industry in terms of how those media are faring, because they have shorter commitment periods.
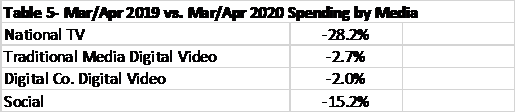
January/February 2020 had witnessed spending on digital video from traditional media companies grow 27%, digital video from digitally centric companies grow 10%, and social grow by 8% (see Table 5).
In March/April, spending on national TV, digital video from traditional media companies and social all turned negative. Spending on digital video from digitally centric companies and digital video from traditional media companies stayed relatively flat. This may reflect some of the increased demand for CTV/ad-supported OTT inventory.
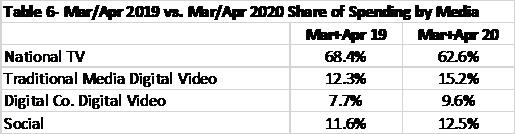
From a share perspective, March/April witnessed a material change in share for digital video from digitally centric companies and social (see Table 6). They now command a combined 22% share of national media spend, up 3 points from 2019. And while spending on digital video from traditional media companies grew slightly, that growth wasn't enough to offset the decline in linear TV spending.
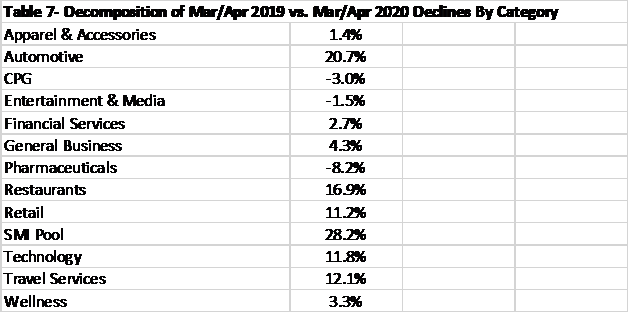
The decline in spending across traditional, digital video and social among national advertisers was widespread across all categories except CPG, Entertainment & Media and Pharma, who actually increased their spending (see Table 7). Three categories- Auto, Restaurants and Retail- account for nearly 50% of the declines.
The shift of share away from traditional media companies to digital video from digitally centric companies and social was driven by Automotive, Financial Services, General Business, Restaurants, Technology and Wellness (see Table 8). Digital video from digitally centric companies and
Click the social buttons to share this story with colleagues and friends.
The opinions expressed here are the author's views and do not necessarily represent the views of MediaVillage.com/MyersBizNet.

James Fennessy
James is the global CEO of Standard Media Index (SMI). He has been with SMI since 2011 when he first joined as Chief Commercial Officer, taking over the CEO role in 2016. SMI is the leading global provider of real-time advertising spend sourced directly from…