ARF Releases Phase 1 Report of its Attention Measurement Validation Initiative
The Advertising Research Foundation has just released to ARF Members its compendium of the world’s Attention Measurement suppliers, a 156-page reference source enabling practitioners to pierce through pitch language (which is thoroughly purged) into the relevant realities of what each company actually does.
Phase 2 will compare findings of participating suppliers in measuring the attention values of the same set of client-supplied creative executions. Clients have supplied creative and the Phase 2 report will not reveal the identity of those clients, yet the clients themselves will receive granular insight provided by ARF in comparing the various suppliers’ measures of the same piece of creative.
Clients who have provided creative have classified them into whether the execution fared above or below average in the marketplace. Thus ARF will have a basis for understanding if a given supplier’s scores appear plausible in relation to reported marketplace performance.
Another perspective that ARF will apply in Phases 2 and 3 is to note the degree of agreement/convergence among the suppliers (aka consilience).
Full Disclosure: Bill Harvey consults on this project for the ARF, and consults/advises/partners with several of the attention suppliers. RMT (Research Measurement Technologies) is included in the Atlas although that company, co-founded by Harvey, appears as an available ingredient that can be combined with any attention measurement in order to reflect the interaction effects (resonance) between the specific environment and the specific creative, which as a second filtration factor in activation can increase the branding and sales effects of attention filtration on its own.
Phase 3 will compare the attention measures of the same set of media environments garnered by each of the participating attention suppliers.
Most of the research companies use eye tracking and device level measurements (e.g. cursor movements, viewability, etc.), in various combinations with other measures such as survey branding questions, biometric measures, neuro measures, sales effects, and persuasion measures.
Definitions of attention vary across the research companies. The companies have also supplied case studies, validation studies, academic support, all of which are provided as links in the Atlas. This means from the Atlas as a starting point, a marketer or media platform interested in attention measurement can branch out and also read a wealth of backup information.
Feeling like a kid opening a Christmas present, I flipped open the Atlas and looked at Amplified Intelligence as a first stop. I had just had tea by Zoom with my great friend Karen Nelson-Field, for whom it was the middle of the night. Karen is broadly regarded as the dean of attention researchers and her first book opened and defined the Era of the Attention Economy. She is now writing the second book, compiling learnings from tens of millions of dollars’ worth of in-market research since the first book. In the Atlas section on Amplified Intelligence, I clicked on “validation” and was taken to a WARC paper.
The paper contained something I had never seen before, and wanted to share it with you: It’s a segmentation scheme for types of attention events.
Pattern types and the relationship with brand outcomes
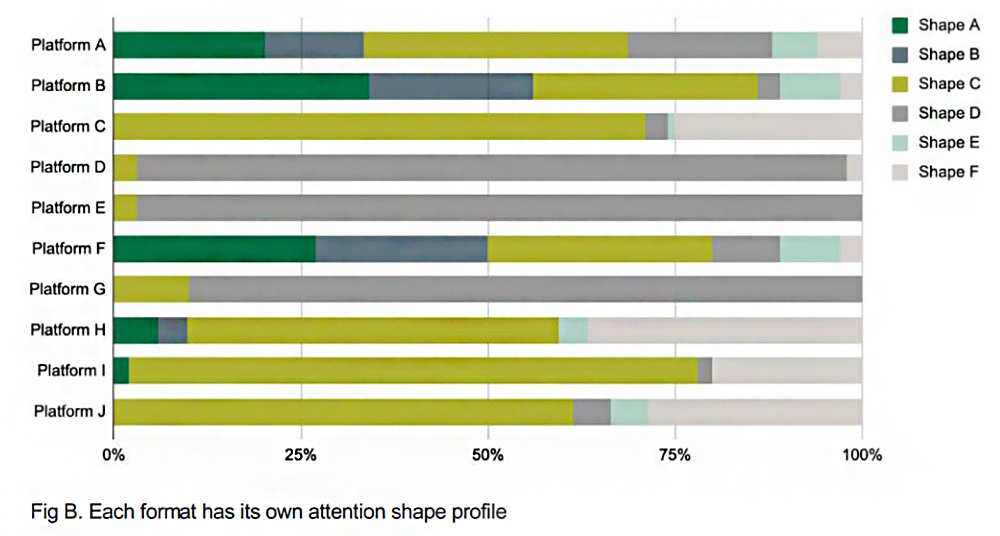
For scrollable formats, of the viewing patterns that were revealed by the clustering method, six shapes were identified as being useful to industry:
A. Long Look – The longest opportunity-to-see time, with 1.5x probability of active attention occurring than passive attention (mobile specifically).
B. Like Glue – Complete concentration on ad view (only 2% of sampled ad views).
C. High Flyer – A high attention peak during opportunity-to-see time.
D. Flicker – Relatively long opportunity-to-see time, with shifts between passive and active attention.
E. Scroller – Fast scroll speed with mainly passive attention.
F. Super Scroller – Shortest opportunity-to-see time and fewest active attention seconds, indifference to ads.
When we removed scrollable formats to focus on TV and cinema environments, four distinct viewing patterns emerged (featured as the top four on the list above). Each ad view was assigned a ‘shape of attention’ profile, and the relationship between the shape and brand outcomes was considered. From here, each shape of attention was classified as having high, medium or low likelihood to drive STAS.
STAS is Short Term Ad-Produced Sales. I realized that this related to the finding that television has much higher attention elasticity according to Karen’s work as compared with digital – digital just cannot go as high. I then saw the following intriguing figure:
That gives you a taste of the depth offered by the Atlas. If you are an ARF Member company or individual, be sure to get your copy from your ARF Representative. If you’re not an ARF Member, you should be, now more than ever.
Posted at MediaVillage through the Thought Leadership self-publishing platform.
Click the social buttons to share this story with colleagues and friends.
The opinions expressed here are the author's views and do not necessarily represent the views of MediaVillage.org/MyersBizNet.

Bill Harvey
Bill Harvey, who won an Emmy® Award in 2022 for his invention of set top box data, has spent over 35 years leading the way in media research with pioneer thinking in New Media, set top box data, optimizers, measurement standards, privacy standards, the A…