Facebook, Nielsen and Online Video: Measure Once, Divide Thrice - Brian Wieser-Pivotal Research

Measuring the scale of online video content consumption is an important factor in quantifying the strength of new forms of television-like media. However, it's important to assess the means of measurement that drive conclusions, too. When we compare data from two of the leading sources of relevant data – compared in detail over the past five years later in this report – online video content consumption equates to either 3% of TV time or 9% depending on whether one relies on Nielsen or comScore data. Although both figures are likely wrong given the exclusion of tablet-based viewing at the present time, we think the real figure is likely closer to Nielsen's total, or a third of comScore's estimates, as we illustrate in more detail below.
By contrast, media agency professionals focused on digital media generally prefer comScore for much of the work that they do. In our view, these buyers tend to rely on comScore in large part because its products are perceived to measure online audience share more accurately, and share is critical in determining which publishers should be included on an RFP (request for proposal) associated with a media buy. However, methodological differences between comScore and Nielsen may become more important as online advertising becomes increasingly important to the large brands who care most about video-related advertising.
Among the catalysts to drive comparisons, we note last week's formalization that Facebook would be deploying video ad units including news that it would provide media buyers with OCR-based demographic data from Nielsen. Facebook, like other digital media owners, is aiming to capitalize on the growth of online video ad spending which is largely driven by the perceptions of consumption growth that Nielsen and comScore capture. While efforts to capture TV budgets will prove to be in vain, in our opinion, we think these units will still help Facebook expand and capture an increasing share of digital ad budgets. In so doing, Facebook will ultimately help promote Nielsen's measurement capabilities to a group of buyers – those focused on digital media – who might otherwise have remained more focused on comScore.
Assessing the scale of online video content consumption is an important factor in quantifying the relative health of new forms of television-like media. For as long as we have sought relevant trends, our preference has skewed towards the passively monitored data collected and organized by Nielsen. Originally this view was informed by media researchers whose perspectives we trusted, reinforced though the landmark Committee for Research Excellence studies which occurred in 2008. As an in-depth ethnographic study of media consumption (and notwithstanding that it was funded by Nielsen, although administered independently) we saw that data from the CRE related to online video consumption proved to be roughly consistent with data that Nielsen was publishing, and which at the time was proving to be very different from data provided by its competitor, comScore.
There were other reasons that we felt the Nielsen data was preferable: when forced to choose between two sets of researchers and methodologies we would want to put more trust in a body that has experienced decades of collaboration with stakeholders, not to mention decades of institutionalized experience in research methodologies relating to seemingly mundane spheres as how to recruit a panel or how to ensure that biases are not built into a sample. Those differences became amplified in subsequent periods, as comScore and Nielsen produced starkly different results over time (as reported by comScore via monthly press releases related to its Video Metrix product and as reported by Nielsen via quarterly releases of various data sets in its Cross Platform Reports).
The summary chart below is normalized on the basis of person-viewing-hours-per quarter, multiplying the average minutes of viewing of online video per person per month or per quarter against the number of people watching online video over the course of three months of time. It is important to note that these figures don't necessarily relate to ad inventory or ad value, as over time we may see different ratios of advertising to content and ads can run in many places without conventional content (as is the case with Facebook's newly announced video inventory). Further, pricing will be a function of negotiating dynamics between different kinds of buyers and sellers. Nonetheless, the scale of online viewing of content should be an important factor in defining the relative importance of online video to the broader media industry.
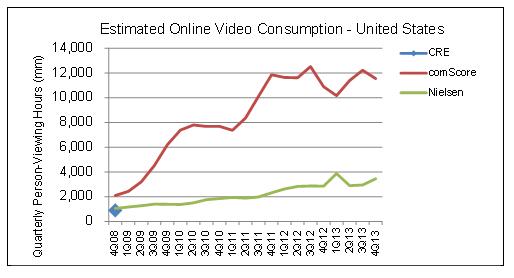
Source: Pivotal Research analysis of comScore and Nielsen data
While the data is not perfectly comparable from quarter to quarter (Nielsen noted measurement issues in 2011 and 2012 which limited the comparability of data across periods) and each will have claimed some differences in what exactly is measured (comScore always included "progressive downloads" as well as streams vs. Nielsen which only includes streams) what is not measured (comScore does not include mobile devices whereas Nielsen does not yet include tablets) and how they measure (comScore measures some publishers directly and other publishers via panel while Nielsen measures all publishers via panel), the trends implied by comScore always seemed unlikely to us.
To take the most recent set of monthly data from comScore at face value for months during the fourth quarter of 2013 would be to imply that the equivalent of 8.6% of TV viewing across the whole population – or almost 15% of time for those who watch online video – occurs on the web. Remarkably, the data would also suggest that consumers in the United States were at this level by late 2011. By contrast, Nielsen's data suggests a figure of more like 2.6% share of time across the whole population and 4.9% across those who watch any online video. Over the past five years, the difference between the two sources has ranged between 2x and 5x, a significant gap. While both figures will be higher with the inclusion of more mobile consumption and comScore's only slightly lower without including progressive downloads, we would guess that such changes would be unlikely to close even half of the gap between the two providers of data.
Despite the issues implied by this discrepancy, we would opine that most of the digital media community maintains a preference for comScore's products over Nielsen's. Different user interfaces, publisher confidence, an aura of "new-ness" or other factors possibly explain this preference. It's also worth noting that the industry uses comScore's data for different purposes than we would – namely to identify which publishers have what share of online video viewing among which consumer segments in order to identify who should be included in an RFP as part of a digital buying exercise. Further, it's probably the case that the regularity with which comScore's monthly data summaries are referenced by the press or used by the equity research analyst community (both press and equity research analysts being noted experts in research methodologies, of course) validates the product seemingly reinforces any advantage that comScore possesses among the digerati.
Given the advantages of incumbency, we have generally presumed that comScore is well-positioned to convince digital media buyers (and their clients) who do not need to integrate their campaigns or campaign data with TV data to rely on comScore's demographics-based product, vCE. By contrast, we have argued that advertisers whose needs are TV-centric will more likely want to use data sets that are integrated to assess the delivery of their campaigns. Given the dominance of TV in the context of any given media campaign, we have presumed that these buyers would ultimately settle in on Nielsen-based metrics given their existing reliance on (and relative confidence in) Nielsen's products.
In this light, last week's news regarding Facebook's agreement to provide Nielsen's demographics-based OCR data in association with auto-play video ads offers Nielsen a useful competitive tool in its efforts to win the hearts and minds of the digital buying community. We have argued previously that Facebook is unlikely to see the TV budgets they covet as a result of its initiative with auto play video ads. (This is because the units will not be perceived by advertisers as comparable, because workflows involved in buying the media are different and because TV buying is still based around content adjacencies while digital buying is mostly based around audiences. However, the ad units will probably help Facebook cement its position with large brands as a primary destination for digital budgets, and on the margins Facebook might see incremental budgets shifting from other digital sources such as Google's YouTube). But as Facebook reports back OCR data to digital buyers who are overseeing these buys, those buyers become increasingly well-acquainted with Nielsen when they might otherwise have been spending time with comScore data.
It is difficult to anticipate the overall experience a digital buyer might have with Nielsen in terms of its interfaces, its data and its people when they work with OCR data. Will it be superior to working with comScore? Only the practitioners will really know, and their perceptions will evolve over time. However, if the relative quality of measurement of time spent with online video is any guide as to the underlying quality of each company's demographics-based online video viewing metrics, we would be surprised if Nielsen failed to improve its position with the digital buying community. It would seem unlikely that OCR and vCE data when compared head-to-head would produce differences that come anywhere close to the 3x figure in time spent that is derived by their different approaches to measuring total audiences or total time spent. But the methodologies that each uses will matter, and will still produce different results when digital media buyers make comparisons on campaigns that happen to use both vCE and OCR. When those results are assessed we can imagine incremental usage of OCR for digital-only campaigns beyond those involving Facebook will follow.
REPORT INCLUDING DISCLOSURES CAN BE FOUND HERE: Madison and Wall 3-21-14.pdf
Brian Wieser is a Senior Analyst at Pivotal Research Group, where he covers securities which are impacted by the advertising economy, including Facebook, Google, Yahoo, Interpublic, Omnicom, WPP, Publicis, Nielsen, CBS, Viacom and Discovery Communications. Brian can be reached at brian@pvtl.com.
Read all Brian's MediaBizBloggers commentaries at Brian Wieser's Pivotal Report.
Check us out on Facebook at MediaBizBloggers.com
Follow our Twitter updates @MediaBizBlogger
The opinions and points of view expressed in this commentary are exclusively the views of the author and do not necessarily represent the views of MediaBizBloggers.com management or associated bloggers. MediaBizBloggers is an open thought leadership platform and readers may share their comments and opinions in response to all commentaries.

Brian Wieser
Brian Wieser is Global President, Business Intelligence for GroupM, WPP’s media investment Group. He is leading GroupM’s thought leadership practice to ensure that WPP’s clients receive actionable marketplace intelligence on markets, audien…