Global Marketing Monitor: Trends From This Week

Key takeaways from this week’s note:
•New small business formation spiked meaningfully in the second half of 2020 in the United States. To the extent these businesses budgeted for advertising in ways that mirrored choices made by older small businesses, these enterprises could have driven a significant portion of the growth in advertising we saw last year.
•With earnings results published this past week, we can see that digital advertising posted a remarkably strong fourth quarter. For all of 2020, they saw a very healthy year with around 13% in the U.S. or only a few percentage points of deceleration in 2020 versus 2019; however, undisclosed political advertising inevitably contributed to the result. Google and Facebook likely sustained their ~70% share of the market.
•E-commerce is another driver of digital advertising, and both Amazon and Alibaba also reported earnings this past week. Amazon's numbers accelerated, led by acceleration everywhere, with a meaningful expansion of growth in Europe. Alibaba's growth rate decelerated sequentially on an organic basis.
We monitor earnings results and public information related to marketers and media owners along with government data and economic releases from countries around the world. We do this to better understand consumer trends as well as advertising and digital transformation issues.
At the start of the global pandemic, we might have expected negative trends to follow for any entity dependent upon small businesses. We weren’t wrong about their weak position overall, but small businesses' activities still emerged in surprising ways. Going back to the global pandemic declaration last March, most observers would have presumed that small businesses would be disproportionately negatively impacted. Consequently, they (and we!) were surprised about the degree to which advertising expanded at Facebook and Google in subsequent months.
Commentary from the companies and our observations indicated that much of this resilience was due to smaller businesses who seemingly shifted resources online rapidly early in the pandemic, despite the particularly weak environment they faced. Instead, they contributed meaningfully to the surprising strength in digital advertising we saw throughout 2020.
New business formation spiked in the second half of 2020. To better understand recent small business trends, we recently analyzed data from the U.S. Census Bureau, specifically looking at total business applications as tracked by Employer Identity Number applications submitted to the Internal Revenue Service.
It turns out these applications expanded dramatically in the second half of 2020, growing by 82% in the third quarter of 2020 and by 27% in the fourth quarter, following on a 3.1% gain in the second quarter and 3.4% decline during the first quarter. In 2019, growth was stable versus 2018, but up 9.2% in 2018 and 7.8% in 2017. More narrowly, if we only look at business applications with first wages-paid date – probably a better proxy for small business formation – growth was 17% in the fourth quarter, following on a 53% gain in the third quarter, a 13% decline in the second quarter and 9% decline in the first quarter.
Growth rates during individual years over the prior decade ranged from -5% to +4%, illustrating the outperformance we have just observed. Note that business applications are effectively “gross” rather than “net” as businesses do not typically apply with an authority to shut down. However, business births and deaths data are tracked by the U.S. Bureau of Labor Statistics with a more significant time lag.
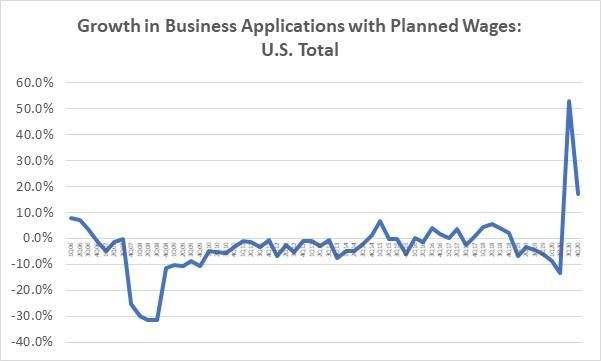
Source: GroupM analysis of US Census Bureau data
New small businesses might have been a factor in digital advertising as well. As opposed to like-for-like small business activity, new small business formation and related activities are a potentially important nuance and possibly a driver of this trend. To the extent that a growing number of newer businesses behaved like slightly older ones and spent money on advertising after forming, to alert consumers of their existence, and then continue to spend based on simplistic rules of thumb such as an allocation of several hundred dollars per month, or a small percentage of expected revenue, and devoted the bulk of their advertising resources to Google and Facebook—as campaign budgets measured in the hundreds or thousands of dollars can be most productively and efficiently deployed to those two media owners—the two technology giants would have disproportionately benefited.
Why this is occurring is unclear. Perhaps laid-off individuals have decided to form their own businesses in greater numbers than we have seen in the past. Or perhaps individuals who have learned how to work from home have realized they can form businesses without as much of the start-up capital historically required of new ventures with physical premises and have become emboldened.
Or perhaps, because the pandemic has introduced new ways for people to buy goods and services, emerging entrepreneurial opportunities are leading to new businesses.
Whatever the reason, the trend is a noteworthy development for the U.S. economy and will be all the more so if it is also occurring in other countries.
While small businesses have not necessarily captured an increasing share of economic activity or revenue over this time, it’s probably more likely that small businesses have continued to lose share to larger ones. Unfortunately for small businesses, they’re not necessarily becoming more important to the economy in aggregate. Within the U.S., companies employing 250 or more people accounted for 52% of all private sector employees in the first quarter of 2000, 52.5% of employees in the first quarter of 2010 and 55.1% in the first quarter of 2020.
That change in share of employment reflected the growing share of revenue that larger companies captured. They saw less of a downside at the start of the pandemic as well. During the second quarter of 2020, those same businesses only accounted for 50.7% of job losses, indicating further employment share and revenue share gains for larger businesses.
What happened in the latter part of the year won’t be known for a few months as that’s when employment data by size of company becomes available from the Bureau of Labor Statistics for the third quarter of 2020.
Similar data for other countries will generally become available at later points in time as well.
U.S. digital advertising grew around 13% in 2020 and by about 28% in the fourth quarter alone; global figures were probably similarly positive. Over the past two weeks, most of the largest digital media owners reported their fourth-quarter results—only Twitter remains to report. With this week’s results, we can roughly calculate the growth rate of digital advertising in the fourth quarter and for the full year 2020.
Based on a composite of media owners we track, we can estimate that digital advertising in the United States accelerated by mid-teens levels sequentially in the fourth quarter to grow on a year-over-year basis in the high-20s (perhaps around 28%) for one of the sector’s best quarters on record. For the year, growth decelerated by only a few percentage points versus 2019 levels, which was approximately a 16% gain, implying around 13% growth for all of 2020. Global figures are broadly similar in terms of their trajectory.
No meaningful commentary or disclosures were provided on the impact of U.S. political advertising on the results; however, with record levels of fundraising and spending in association with the 2020 election, the election likely accounted for several percentage points of the full years’ growth (and a much higher share of the fourth quarter’s).
A much more significant factor, however, was most likely the aforementioned small business trends because larger brands did not collectively increase their spending at the levels of ad revenue growth that digital media experienced.
Google and Facebook likely accounted for just over 70% of U.S. digital advertising in 2019 and likely retained their share of the digital market in 2020 on a combined basis. We can roughly calculate that Google and Facebook captured 70% of digital advertising in the United States during 2020 but, as we know that larger brands tended to shift their spending toward other media owners last year, this share was almost certainly sustained by the increased presence of smaller businesses in the digital advertising market.
Among the platforms benefitting from share shifts were Amazon, whose advertising business probably saw 70% year-over-year growth—the company does not disclose advertising explicitly. Still, it includes it as the primary activity in one of its reporting lines. Combined, the three most prominent sellers of digital advertising would have seen around 80% share in 2019 and a higher level in 2020.
Amazon’s advertising revenues grew ahead of their total e-commerce business in 2020. On its release of earnings this week, Amazon recorded revenue growth of 44% on the quarter, an acceleration from the third quarter’s 37% pace and the full year’s 38% expansion. Total GMV (Gross Merchandise Value) of physical goods sold online at Amazon amounted to nearly $500 billion during the year on our estimates.
For reference, during 2020, we think global e-commerce sales of physical goods amounted to $3.9 trillion, and total comparable retail sales were around $23 trillion. On this basis, we estimate that Amazon accounts for 13% of all e-commerce and 2% of all retail commerce globally. However, it certainly represents a much higher percentage in its home U.S. market.
Amazon’s first-party online sales, which accounted for around 38% of total sales during the year, grew 46% during the fourth quarter and 40% during the year. Third-party sales grew even faster, rising by 57% during the quarter and by 50% during the year, gaining in importance to Amazon and accounting for approximately 62% of sales in 2020 versus 60% in 2019.
International revenues accelerated massively at Amazon with new lockdowns in Europe. Many of Amazon’s international markets were not as well developed as the U.S. before the pandemic, although they are becoming much better developed now. Across all business lines outside of AWS, total international sales (31% of non-Amazon Web Services revenue at Amazon) accelerated meaningfully in the fourth quarter, with government actions related to lockdowns in the U.K. and elsewhere in Europe cited as a driving factor.
The cadence of the year has been particularly remarkable outside of the U.S., as international non-AWS sales growing 18% in the first quarter followed by 29% in the second quarter, 33% in the third quarter and 50% in the fourth (all on a constant currency basis).
Alibaba grew 27% across all business lines, ex-Sun Art, with e-commerce GMV likely growing by ‘teens levels. Of course, in China, e-commerce has accounted for a much higher retail activity share than other markets for some time. At Alibaba—the world’s largest e-commerce platform operator with $1 trillion of gross merchandising volume in its most recent fiscal year, ending in March with nearly a quarter of the world's total activity—company-wide revenue grew by 37% or 27%, excluding the recent acquisition of hypermarket retailer Sun Art.
This was a deceleration from the calendar third quarter’s 30% expansion.
Customer management and commission revenue, which reflects revenue from e-commerce-related fees and advertising or similar revenues, grew 20%. Within that activity, TMall, which accounted for 49% of the most recent fiscal year’s GMV across all of Alibaba, saw physical goods growing 19% during the quarter. This was a slight deceleration from the calendar third quarter’s 21% pace and 27% during the second quarter.
While the company did not disclose GMV growth for Alibaba’s other primary e-commerce business, Taobao, it typically been outpaced by Tmall by double digits. Most recently, for fiscal 2020, TMall grew 23% while Taobao grew 8.7%.
To the extent this held in the fourth quarter, growth in GMV on a company-wide basis would have been in the 'teens. Within this data, we can see the degree to which the 11.11 festival is increasing in importance. During the prior fiscal year, 11.11 accounted for 6% of all GMV despite representing only 3% of all calendar selling days.
The company previously reported that the festival accounted for 498.2 billion RMB in sales in 2020, up 26% over the prior year and, if quarterly growth was in the mid-teens, 11.11 grew in terms of its share of GMV during the quarter.
Large business/small business dynamic may be playing out in e-commerce as well. Interestingly, at Amazon, small and medium-sized companies were noted as growing by 50% during the fourth quarter, which would seemingly represent a loss of share versus larger third-party sellers on the company’s platform.
We saw this mirrored in results from several of the world’s largest packaged goods companies who also reported in the past few weeks.
Unilever, P&G and Colgate, among others, produced growth in total e-commerce sales, often in the 50-70% range. While those sales include e-commerce activities via traditional retailer and D2C channels, the data nonetheless reinforces our initial point around the more favorable positioning of larger businesses relative to small ones. Putting the public policy pros and cons of such an outcome aside, we’ll see this continue to play out in terms of the share of economic activity they will capture through the remainder of the pandemic and likely beyond it as well.
READ MORE OF BRIAN'S POV'S HERE
Copyright and Republished with permission.
Click the social buttons to share this story with colleagues and friends.
The opinions expressed here are the author's views and do not necessarily represent the views of MediaVillage.com/MyersBizNet.

Brian Wieser
Brian Wieser is Global President, Business Intelligence for GroupM, WPP’s media investment Group. He is leading GroupM’s thought leadership practice to ensure that WPP’s clients receive actionable marketplace intelligence on markets, audien…