How the C Suite Can Be Certain About Digital vs. TV ROAS

For the past 15 or so years it has been increasingly easy to get C Suite approval to spend more money in digital. The C Suite's own family is enough to prove that digital is only getting more important in our lives every day. Going with the flow of the beliefs of upper management never cost anyone their job.
Despite the obviousness of the above, billions of dollars have been placed in digital that would have been better placed in television, and this process of shift continues to happen even though studies have shown that the larger brands are oversaturated in digital and the next dollar placed there will not be repaid.
Because of the amounts of money involved, some of the C Suite has some concern about this situation and would love it if there were a way to be sure which way to go in this situation.
Fortunately, there is a way to be sure and a solution to address the problem.
The impact of advertising on immediate brand buying and on long-term affection for the brand turns out to be only peripherally related to how people use their time. They indeed spend a lot of time with digital, and often ads are busily covering a lot of the screen, and the average person spends some number of calories per day avoiding looking at them.
The average person's typical attitude toward those ads is annoyance, except when something about the come-on matches a lookup table in the individual's subconscious and noticing happens. If that extra fraction of a second of attention continues to resonate with the individual's subconscious, engagement may also occur. Thousands of ads appear in the viewability window for every engagement that occurs.
Television (including streaming), on the other hand, is a more laid back environment in which ads -- if carefully matched to program contexts -- may receive carryover attention simply because the mood has not yet been broken.
The solution alluded to above is a method that has been used to create the entire field of science, which in more clearheaded moments, most human beings consider pretty darn important. It is the method being used right now to create vaccines against the pandemic, on which billions of our own very lives depend.
It is a version of Random Control Trials (RCTs) known as Intent to Treat experiments (ITT).
In ITT, one takes any relevant sample of human beings (or guinea pigs, or electrons, etc.) and splits it randomly into at least two pieces (which may be of unequal size, i.e. the control group so long as it is large enough, does not have to be the same size as the treatment group).
Let's imagine that one is testing advertising in regular TV, vs. the same premium professional content delivered by streaming, vs. YouTube, vs. Facebook. Let's say it's a million dollars in each of the four media types. One sample of IDs is used, broken into four parts, and each of the four media types gets its own IDs from that same original sample. A final piece of the original sample gets only the media and promotion that is already falling everywhere on everybody from the brand (including the four treatment groups), and that is the control group.
It's important that these IDs be ones whose purchases of the brand can be tracked by the brand or a third-party research company the brand uses. For some brands it will not be purchases, it will be acquisition given the average value of an acquisition in dollars (Consumer Lifetime Value aka CLV aka LV).
The analysis is simple: I gave you, e.g. YouTube, a million dollars. What did you incrementally give me back? How many more sales (or acquisitions weighted by CLV to convert to dollars the brand will get back) came out of your experimental cell vs. the control group?
You'll notice that impressions are not tracked, nor reach/frequency, nor engagement, etc. These are all interim measures, and in ITT they are ignored, to focus solely on input-output economics.
You'd think that the C Suite would love to forget the "mushy" measurements of which it has been spectacularly skeptical and denigrating forever. However, perversely, these "pink blankey" (a baby's pink blanket) stalwart metrics are now somehow missed, and the typical reaction is to pull back and question the goodness of such research, and to think of ways that the old ways be also added back in. This is unnecessary but eminently do-able. In the ARF 605 Central Control Bill Harvey Consulting initiative called RCT-21,participating brands are able to overlay supplemental measurements of all kinds.
However, the main point is that by using ITT, and ignoring interim metrics, one can gain as much certainty as quantum physicists who invented television, the atom bomb, transistors, nanotech, etc. had and still have. Does digital deliver as much incremental return as TV or premium streaming? It would not seem so based on the existing evidence, yet the existing evidence has not done much to stop the gold rush to further escalate industry largesse to digital. Is it time to perform one last check on this large drain or shall we keep giving more without taking one percent of one percent of the money we are spending in digital to do an ITT? ARF makes it easy; your own teams can learn the ins and outs of doing this science on their own after that, and you will always have this valuable new certainty tool in your arsenal.
Or, you can just keep on doing what you have been doing, ignoring evidence such as this:
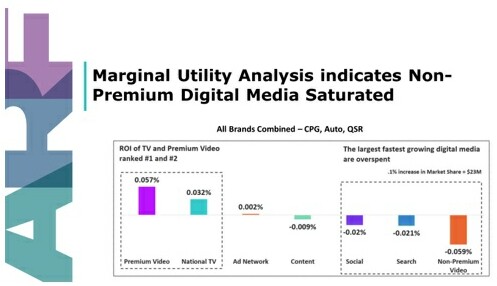
If you have not been spending that much in digital, this chart might not apply to you: These are the major advertisers in CPG, Auto and QSR, the top spending 5-10 advertisers in each category. If you have been spending less in digital, it might not be topped out for you. ITT can tell you how much you are getting from each media type. Don't you need to confirm the results of MMM, MTA and single source? Haven't you wanted to?
There is no less expensive nor more bulletproof way of doing it than RCT-21.
None of the brands reflected in the slide above have done it yet. Only four of them grew market share between January 2014 and June 2019. Is that what you want?
Good luck in any case!
Click the social buttons above or below to share this content with your friends and colleagues.
The opinions and points of view expressed in this content are exclusively the views of the author and/or subject(s) and do not necessarily represent the views of MediaVillage.com/MyersBizNet, Inc. management or associated writers.

Bill Harvey
Bill Harvey, who won an Emmy® Award in 2022 for his invention of set top box data, has spent over 35 years leading the way in media research with pioneer thinking in New Media, set top box data, optimizers, measurement standards, privacy standards, the A…