Howard Shimmel: The Dollar Value of Stability

When I brought forward set-top box data in the 90s, the two main reasons for it were stability and addressable commercials. These are the same reasons why the industry asked Nielsen to add big data to its panel, which was turned on this year.
When Howard Shimmel was running research at Turner, he and Dan Aversano created a very advanced optimizer which used forecasted audience data rather than historical audience data. When Howard resigned from Turner, it was not long before he used his know-how to, with Dan Aversano and others, create datafuelX (DFX), a very advanced optimizer for television networks to use to create the best targeted outcomes for specific advertiser data-driven advanced audience linear campaigns. Of course, that optimizer forecasts future audiences. Therefore, stability is very important because instability obviously causes increases in the size of errors in forecasted data.
Howard has done what I think is the smartest analysis I have ever seen of the effect of audience measurement stability on the economic risk networks take by guaranteeing audience sizes. I will share with you the high points, and the complete analysis is available here.
The analysis compares the Mean Absolute Percentage Error (MAPE) in forecasting audiences based on panel only versus panel plus big data. At the time, some months back when Howard was doing the analysis, he was not able to get all the big data but only a subsample of it, and he is now repeating the work using the full Nielsen big data sample plus panel. Therefore, the stability of panel+BD (BD=big data) is even better than is shown by this analysis.
The advanced audiences used were MRI fusion product users with a sex/age audience demo target of adults 18+.
In the following tables, a minus sign is a good thing; it means a reduction in instability. The larger the size of the minus number, the better.
This first table represents two network groups and the individual networks in each group:
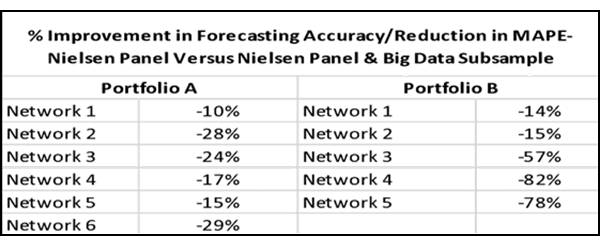
As you can see, the addition of even a part of the big data sample made double-digit improvements in stability as compared to the panel alone.
The average improvement was 23% less instability for one network group and 72% less instability for the other network group:
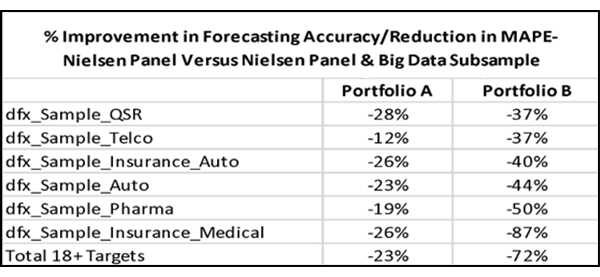
The medical insurance target group was the smallest target, and therefore, it is not surprising that it showed the largest improvement for one of the network groups.
Howard suspected that the lower the ratings for a given network, the more improvement would be seen, so he analyzed the networks after putting them into groups based on quintiles of average rating size:
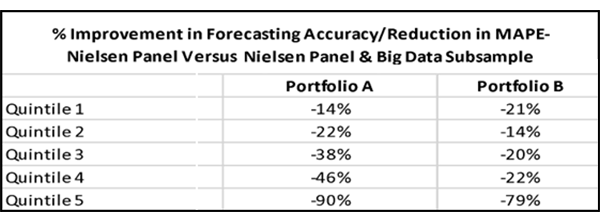
Sure enough, the data support a fairly consistent pattern of increased improvement, the lower the rating size of the network. The lowest-rated networks benefit the most from the addition of big data to the panel.
Now comes the really interesting part, the financial implications. For this, I shall take a straight extract of Howard’s own words:
Financial Impact Modeling
To understand the financial implications of improved forecast accuracy, we modeled a standard cross-network, daypart-realistic audience plan using average panel audience budget and average panel target CPM benchmarks.
The key metric we analyzed was Estimated Financial Exposure, which represents the dollar value of average variability between forecasted and actual impressions. In other words, this shows how much publishers or advertisers might be working within — positively or negatively — due to forecast uncertainty on a given audience deal.
- Budget: $415,868
- Target CPM: $180.37
- Average Absolute Difference from Target Delivery (Panel): 19.38
- Estimated Financial Exposure (Panel): $80,595
This means publishers can be operating within a ±$80K swing in forecast-based audience delivery.
With the improved accuracy seen using big data (14.85 absolute difference), the exposure is reduced:
- Estimated Financial Exposure (Big Data): $61,755
- Net Savings: $18,840
- % Savings: 24%
These results reflect just one campaign — but the financial relevance scales significantly. Across larger portfolio deals or quarterly planning cycles, even modest improvements in forecast precision can yield substantial reductions in liability and exposure, delivering real value both operationally and financially.
Another way to think about the financial benefit is from the perspective of inventory utilization. Let’s assume that the publisher wanted to insure 100% delivery to target, and scheduled ADUs to cover the forecasting error. Using Nielsen Panel data, that publisher would need to schedule 24 ADUs for every 100 paid units; using Big Data, that publisher would need to schedule 17 ADUs for every 100 paid units. While this doesn’t seem like a huge savings of inventory, 7% increase in inventory yield across all DDL deals is material.
What Howard is showing is that the benefits to the sell side of increased stability, even based on only a portion of the big data, can in normative cases be in the ballpark of from ∼7% to ∼24%. More inventory available to sell, less risk of having to give free units. For the big players whose annual ad revenues are in the region of $5B each, these percentage improvements translate to hundreds of million of dollars per year.
Bigger Menus Make Viewers More Fickle
There is evidence to suggest that there is more unpredictable, disloyal viewing behavior now than there was in the 1960s, when there were essentially three viewing choices. The more choices we have, the more fickle we become, the more we are willing to go beyond the programs we know always entertain us. This is most obvious when big data are compared to panel data in terms of “do they spike up and down in the same places?” In this earlier article, I demonstrate that there is instability in the viewing reality that cannot be removed by measurement improvements. This fickleness factor makes it all the more important to include big data in the most scientific ways possible with the best available panel data, since there is a degree of instability in the real world, so it is best to minimize as much of the sampling error as we can.
Cover Image source: Beet.TV Howard Shimmel video interview
Posted at MediaVillage through the Thought Leadership self-publishing platform.
Click the social buttons to share this story with colleagues and friends.
The opinions expressed here are the author's views and do not necessarily represent the views of MediaVillage.org/MyersBizNet.

Bill Harvey
Bill Harvey, who won an Emmy® Award in 2022 for his invention of set top box data, has spent over 35 years leading the way in media research with pioneer thinking in New Media, set top box data, optimizers, measurement standards, privacy standards, the A…