Major QSR Brands Near ROAS Optimization; More Broadcast Entertainment Needed
Quick Service Restaurants are a category that appears to have highly accurate analytic tools guiding their nimble adaptation to market forces. From year to year, they dial up or down certain media types exactly as they would if they were studying ROAS (Return On Ad Spend) patterns very carefully and continuously. If QSRs are, in fact, using such ROAS measurement platforms, we can expect to see an increase in their media allocation to Broadcast Entertainment. Continue reading to learn not only how we arrived at this conclusion, but how brands in all product/service categories can affordably maintain an optimal media allocation to produce maximum current year sales.
Major national brands in all product categories face a problem that smaller brands do not experience: media saturation. It’s a quality problem to have but a problem nevertheless, because if not being tracked appropriately for impact, money continues to flow to media types that no longer contribute to incremental sales, thereby not paying back the advertising investment. Oversaturated media types are topped out—they are as good as they are going to get unless there is a change in product, offer, target, messaging, creative or another new factor.
Bill Harvey Consulting’s longtime work on an ongoing ROAS study across multiple top brands proves this out. The chart below illustrates the ROAS saturation pattern for the composite of CPG, Auto and QSR over a five-year period covering $48 billion in ad spend and $2.2 trillion in sales:
CPG, Automotive, and QSR Marginal Utility ROAS U.S. Jan. 2014-June 2019
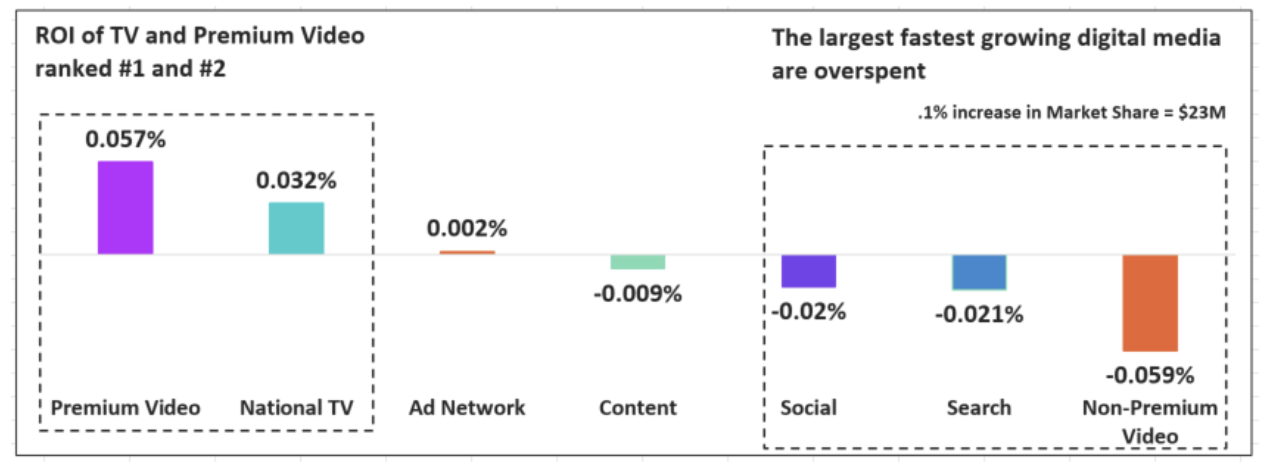
As you see, these brands overspent in non-premium and non-video digital as indicated by the negative ROAS. Although a negative ROAS could mean too much frequency in that media type, creating a consumer backfire effect, in most cases it simply means that the overall sales effect is being hindered by depleting spend in the non-saturated media types in favor of saturated media types. This form of multiple regression analysis is called Marginal Utility, and it predicts the effects of the next million dollars invested in each media type. A downward pointing bar means that the media spend exceeds the ability to drive sales effect.
The latest study’s focus on QSR is at the behest of FOX, the sponsor of these BHC ROAS studies, as an area where it has always had a particular strength in delivering heavy users and as part of its investigation of the effectiveness of its considerable food content. The newest piece of this exercise therefore covers five of the top QSR brands we’ve studied since 2014. These brands have continued to thrive, with four out of five of them increasing sales in the last few years. They represent $10.9 billion in ad spend and $349.6 billion in sales, bringing the total over the 9.75-year span to $59 billion in ad spend versus $2.6 trillion in sales. And the findings:
The two media types still unsaturated for these leading QSR brands are Big 4 Broadcast Network Entertainment and Premium Digital Video. The word "Entertainment" in this analysis is highly specific: it excludes sports and news, both of which are included in Broadcast & Cable Non-Entertainment. Premium Digital Video denotes streaming services owned by the television networks and any other digital video content at that world class professional (rather than user generated) production level.
For many, that Broadcast Entertainment emerges as underutilized in its ability to lift sales is likely a surprise. The obvious reasons are the quality of the program environment and its greater ability to generate campaign reach compared to cable and non-premium. Both factors lead to higher ROAS. A less obvious factor is resonance: the alignment of the subconscious motivators in an ad with the subconscious motivators in a television series, provided for by the rich tapestry of motivators in premium TV-based content. This cutting-edge variable measured by tech company RMT is validated to predict sales and lift ROAS by independent studies from several sources including the ARF Cognition Council. Television entertainment series tend to have more DriverTags (265 empirically derived behavior driving psychological memes) than any other electronic media type, thus on a probability basis, entertainment has the highest likelihood of amplifying the effect of an ad.
Why Broadcast Entertainment then? While it does have a reach advantage and most practitioners would also judge that broadcast also has an overall quality advantage vs. cable entertainment and non-premium digital, collectively these are not the main factor: instead, it is that these QSR brands have been using cable entertainment heavily already. They have not (for the usual CPMania reasons) been using broadcast entertainment as heavily as they should be, according to the ROAS data. QSR brands have also been using sports programming heavily.
Could the need for more entertainment also be psychologically tied to the pandemic and the other negative states of the world that form the backdrop for our lives now? It seems like a reasonable conjecture.
For readers who would like to employ multiple regression analysis for ongoing continuous analysis of these empirical findings for their own brand and for each of their competitors, after calculating the ROAS scores by brand by media type, and performing Marginal Utility Analysis, is there more that can be done? Yes, it’s possible to use R scripts (can also be done with other statistical software) to perform ROAS Optimal Allocation Analysis. We used R and a "brute force" paradigm (generating all possible allocations and predicting the ROAS of each, then have the system pick the allocation with the highest ROAS).
Here's what that looks like for the average of the five QSR brands:
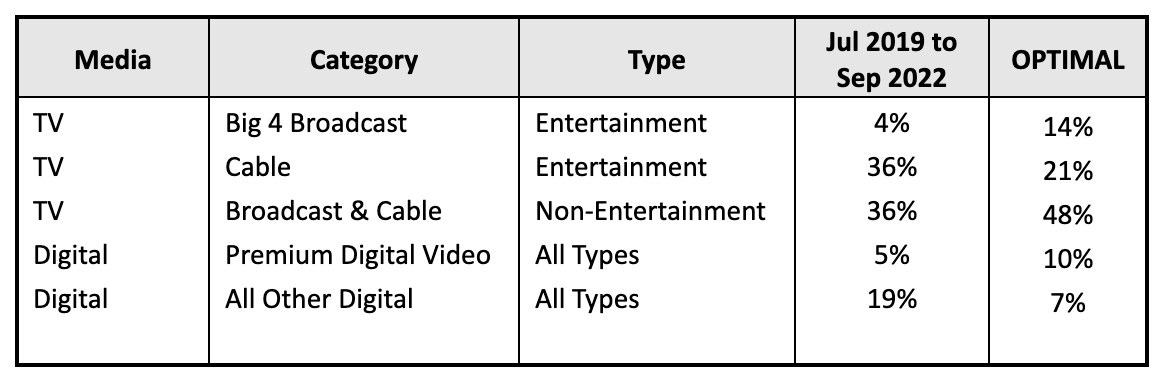
In addition to pointing to an increase in the allocation to Big 4 Entertainment, the optimization recommends doubling the dollars in Premium Digital Video, bringing TV Sports and News up to roughly their percentage in early 2019, and cutting back in Cable Entertainment, which had recently been 90% of total TV Entertainment, to 60% of TV Entertainment dollars.
To many readers, the optimal allocation for these QSR brands may seem biased against digital, but that is not the case; the same method used for automotive and CPG, for example, shows higher optimal allocations for digital, especially for auto. Digital (especially premium) is more beneficial in terms of ROAS for considered purchase categories, including automotive, travel, beauty, fashion, financial services, insurance, etc. QSR is a category where digital does not have the payback of TV, though it earns a significant allocation (17%), with most (10 of 17 points) of that allocation falling into premium digital video.
This methodology is not recommended as the only way to judge advertising effectiveness and optimal allocation. The other valuable methods to use include:
- Random Control Trials (RCTs): the use of random holdout groups
- Crossmedia singlesource: NCS, Neustar, 605, VideoAmp, et al
- Branding studies using similar singlesource methods: 605 et al
By using multiple methods, the imperfections in each method can be partially ameliorated, and reality can be studied from many more angles.
Our thanks to Fox for sponsoring this QSR study.
Self-published at MediaVillage through the www.AvrioB2B.com platform.
Click the social buttons to share this story with colleagues and friends.
The opinions expressed here are the author's views and do not necessarily represent the views of MediaVillage.com/MyersBizNet.

Bill Harvey
Bill Harvey, who won an Emmy® Award in 2022 for his invention of set top box data, has spent over 35 years leading the way in media research with pioneer thinking in New Media, set top box data, optimizers, measurement standards, privacy standards, the A…