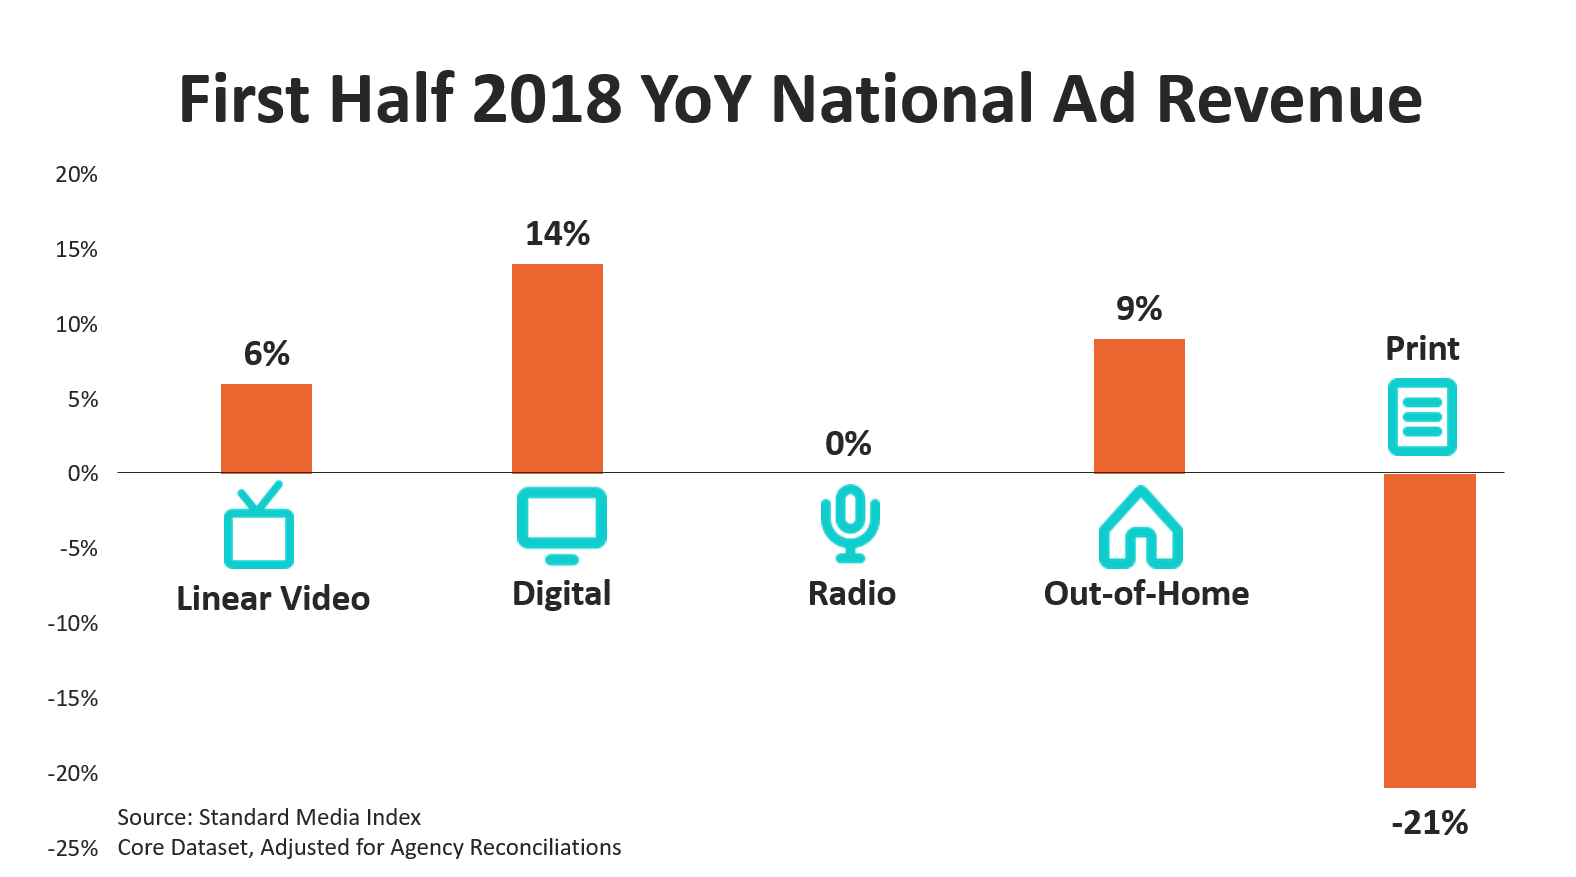
National Advertising Market Gains 8% in First Half of 2018

The National Marketer Advertising Marketplace gained 8% in the first half of the year (January–June), aided by additional revenue from the Winter Olympics and the World Cup. Looking across platforms, digital was the strongest performer this half, growing 14%. That was followed by out-of-home at 9%, linear video at 6%, radio (which remained flat) and print at -21%.
First Half National Television Results
At the end of the first half of the year, we’re seeing TV Network Groups focus on linear television revenue vs digital, rather than the traditional comparison of cable vs broadcast. TV Networks’ combined digital revenue for the first half of the year is up 17%, but only makes up a small fraction of the income from linear.
National television revenue grew 3% in the first half (H1) of 2018 to $22 billion; however, gains were due entirely to the Olympics and the World Cup. Excluding the revenue from both of those, national TV was down -1%. In the first half of the year, revenue from the upfront market fell -1.5% while revenue from scatter grew 18.3%.
Despite plans by TV Network Groups to reduce ad time, the number of 30-second equivalized spots increased by 3.9% in H1, while revenue only grew 3%. Meanwhile, the number of unpaid spots -- also known as makegoods or ADUs -- stayed flat at 0.4%.
Sports
Sports programs were standout performers for the first half of the year. The genre was up 17.3%, thanks to the Olympics and the World Cup. Among TV Network Groups, Comcast Corporation was the clear leader in sports this half-year. Having aired both the Olympics and the Super Bowl, Comcast earned 33% of the revenue from TV Sports programming. That’s followed by 28% share from The Walt Disney Company, which saw 10.5% year-over-year (YoY) revenue growth on ESPN during the first half of the year. The third highest revenue earner in Sports was Time Warner at 13%, whose Turner Broadcasting channels -- TBS and TNT -- gained the rights to air the final three games of the NCAA Basketball Tournament. CBS aired the Final Four semifinals and National Championship games in 2017.
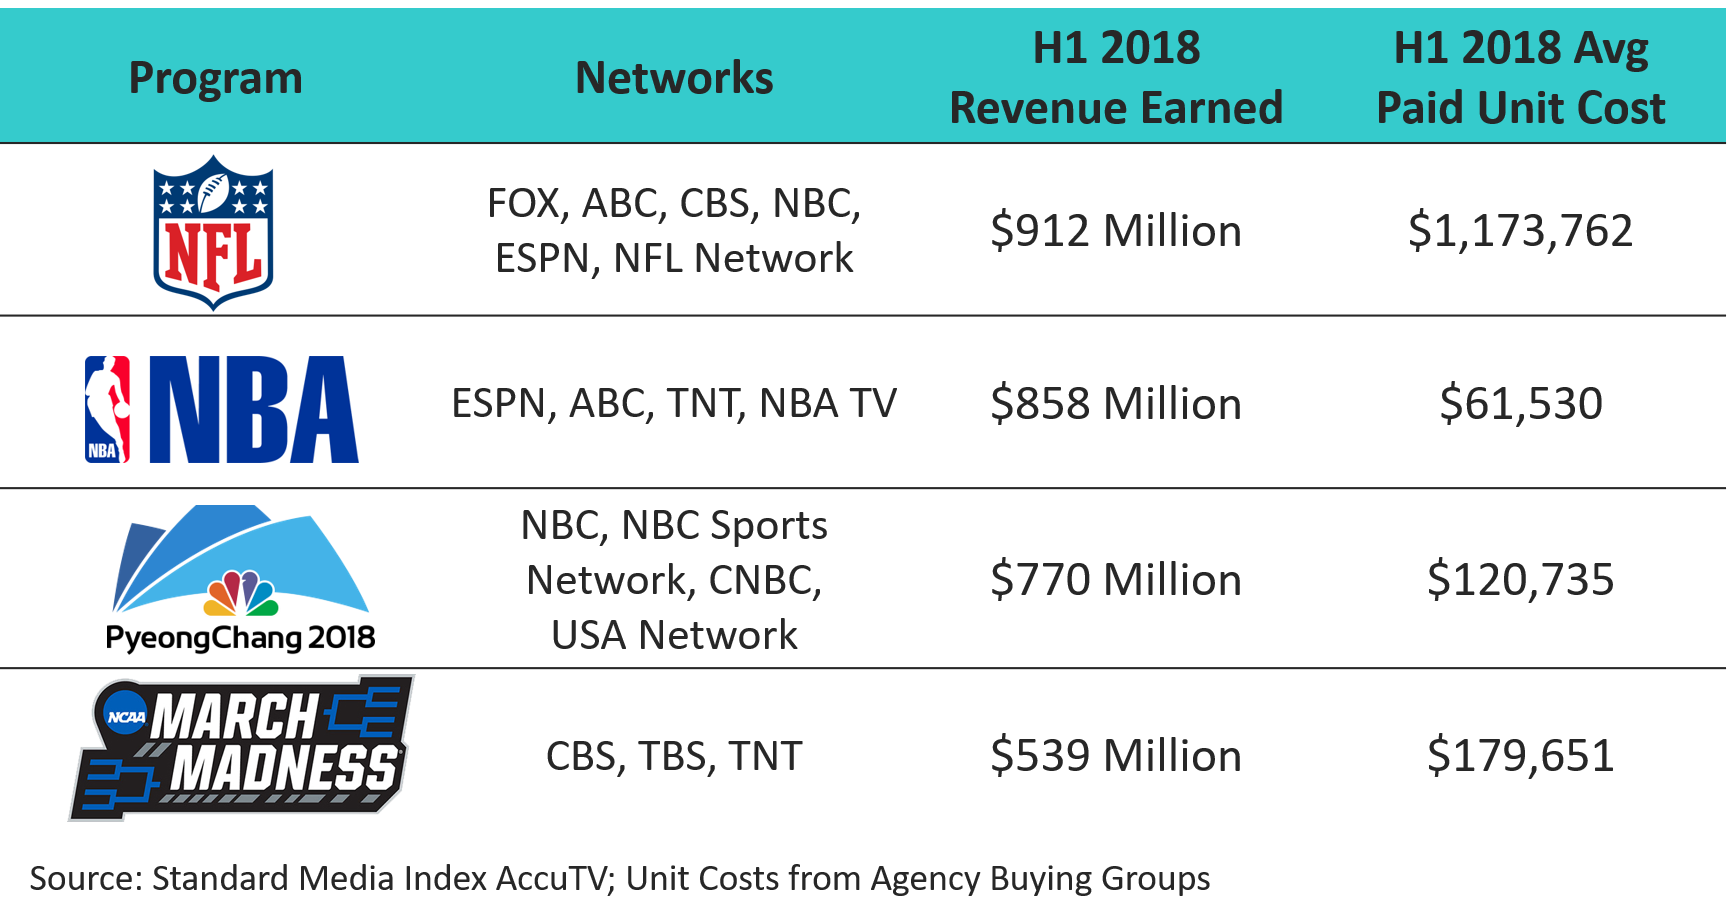
The biggest money-makers in sports in the first half of this year were the NFL, which earned $912 million during the post-season and the Super Bowl, despite having one less week of games than in 2017. That’s followed by the NBA at $858 million, the Winter Olympics at $770 million and the NCAA March Madness Basketball Tournament at $539 million. All of these figures are in-game only.
Entertainment
Revenue from entertainment programming, excluding kids, was slightly lower than it was in the first half of 2017 at -0.7%. Comcast Corporation was also the leader in this genre with 19% market share. Comcast’s NBCUniversal got a boost from the smashing success of This Is Us, which increased paid unit costs by 257% YoY. The second largest TV Network Group is the newly-formed Discovery, Inc. Of the group’s portfolio of networks, HGTV (formerly of Scripps Networks Interactive) brought in the most revenue. TLC grew the most YoY at 20.4%.
Rounding out the top five largest TV Network Groups in entertainment were Viacom, Inc. at 13%, Time Warner, Inc. at 10% and CBS Corporation at 10%.
News
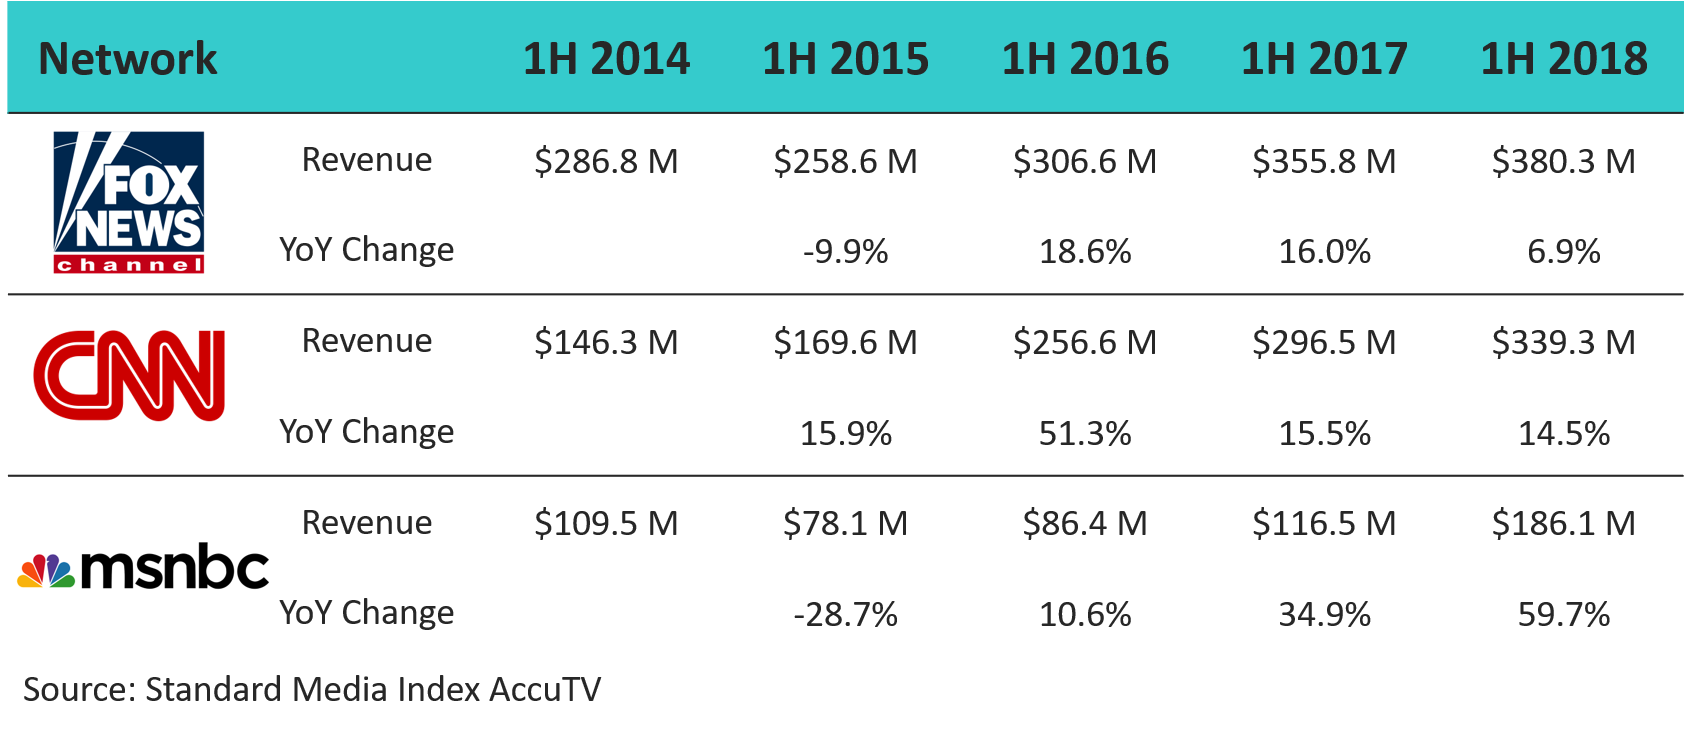
Cable news saw a spike in 2018 as political woes and partisan debates consumed national attention. The five cable news networks -- Fox News, CNN, MSNBC, CNBC and HLN -- grew a combined 14% YoY in H1. Among the networks, MSNBC has been a powerhouse, growing revenue by 60% YoY during the first half. The next highest growth came from CNN at 15%. Excluding sports programming that occurred on these networks, here is a look at the revenue growth over the past four years.
Meanwhile, broadcast news is down -12% in the first half of the year. In fact, the genre has lost revenue every month so far in 2018. All of the Big Four broadcast networks lost revenue from news programming YoY.
First Half Digital Results
Among digital platforms, internet radio companies saw the most advertising revenue growth at 55% YoY. Pandora Media grew revenue by 66% and Spotify by 40%, while iHeartMedia’s internet radio revenue fell -13%.
Meanwhile, social networks grew 48% in the first half of the year, largely driven by Facebook and Instagram’s combined 56% revenue growth. Twitter gained 38% YoY and Snap increased revenue by 11%.
Video is the new frontier for digital marketing as advances in consumer bandwidth capacity have allowed the content form to develop. Among video publishers, legacy and pure digital, Google held 20% market share (all from its YouTube platform) which is down from 24% just two years ago. Legacy publisher Time Warner was close behind (17.4%), driven by its sports property.
Hulu (12.3%), Comcast (12.0%), and Disney (10.1%) also broke the 10% share threshold. Of these, only Hulu and Comcast’s NBCUniversal properties demonstrated market share growth during H1 2018. NBCU’s performance remained positive in Q2 2018 even without the Olympics.
Advertisers by Category
Across national TV, the auto industry spent the most on advertising in the first half of 2018, although that figure declined by -4% YoY. Among automakers, the Ford Motor Company reduced its overall television spend by -26%; however, the company invested heavily in national TV advertising for its F-150 truck. Nearly all of that F-150 spend -- 88% to be exact -- went towards sports programming with 44% specifically dedicated to the NFL.
The next largest spenders were prescription pharmaceuticals, which increased spend by 11%; then food, produce and dairy (-7%); insurance (13%), and entertainment (0%).
Looking at advertiser categories across all platforms, each of the top five categories increased spend compared to last year. The telecommunications industry was the largest spender in the first half of the year, increasing 6% YoY. That is followed by autos (6%), prescription pharmaceuticals (13%), quick serve restaurants (20%) and insurance (6%).
Among prescription pharmaceuticals, Bristol-Myers Squibb tripled its advertising. The drug maker put 85% of its ad dollars towards the OPDIVO class of medications, used to treat cancer. Sixty-eight percent of the OPDIVO advertising was on television, 20% was digital, 8% was magazines and 4% was out-of-home.
Methodology
SMI sources its data from the raw invoices from the media agency holding groups to see the actual dollar amounts spent on each ad buy. We work with five of the seven major media holding groups -- making up 70% of the national TV market -- and model out the remaining 30% using occurrence data to determine revenue. Market share percentages only include TV networks within our pool of data. To provide the highest accuracy, the average paid unit cost data only includes data directly from the agency groups; it does not include extrapolated numbers.
Click the social buttons above or below to share this story with your friends and colleagues.
The opinions and points of view expressed in this content are exclusively the views of the author and/or subject(s) and do not necessarily represent the views of MediaVillage.com/MyersBizNet, Inc. management or associated writers.

James Fennessy
James is the global CEO of Standard Media Index (SMI). He has been with SMI since 2011 when he first joined as Chief Commercial Officer, taking over the CEO role in 2016. SMI is the leading global provider of real-time advertising spend sourced directly from…