National Rating Swings are Mostly Real -- It’s Reality That’s Unstable

Back when the average primetime network program had an 18.0 rating, the sampling wobble that occurs in all data except for a true census was never thought of as a problem. But today, when the average rating is below a 1.0 because of the vast ocean of program choices, broadcasters and others are understandably displeased to see a series’ ratings go up and down from telecast to telecast. It's a hazard to planning and running a business which depends on those numbers. Stability is a target condition.
Nielsen, for example, is investing heavily in research to finalize an algorithm that will enable its integrated panel and big data measurements to be rock steady without introducing biases -– the stability of the big data with the validity of the panel. It’s a math problem. After months of thinking by a lot of smart people, we are closing in on the ultimate integration of the methods developed during 2022, which threw off an added benefit of increasing the accuracy of smart TV data. I’m personally confident that the new general methods generated in 2022 will integrate for maximizing validity and stability at the same time, in both national and local.
I had requested some views of big data and Nielsen panel data and saw some unexpected patterns in them which changed the way I looked at the situation of stability.
The set-top-box data (also known as Return Path Data or RPD) and the Nielsen national panel data seem to move closely together, going up and down at the same time, and almost to the identical degree. This chart below is a typical example. This analysis is thanks to Nielsen’s Cermet Ream, using RPD data after application of the Nielsen On/Off algorithm which corrects for the set top box on/TV set off condition:
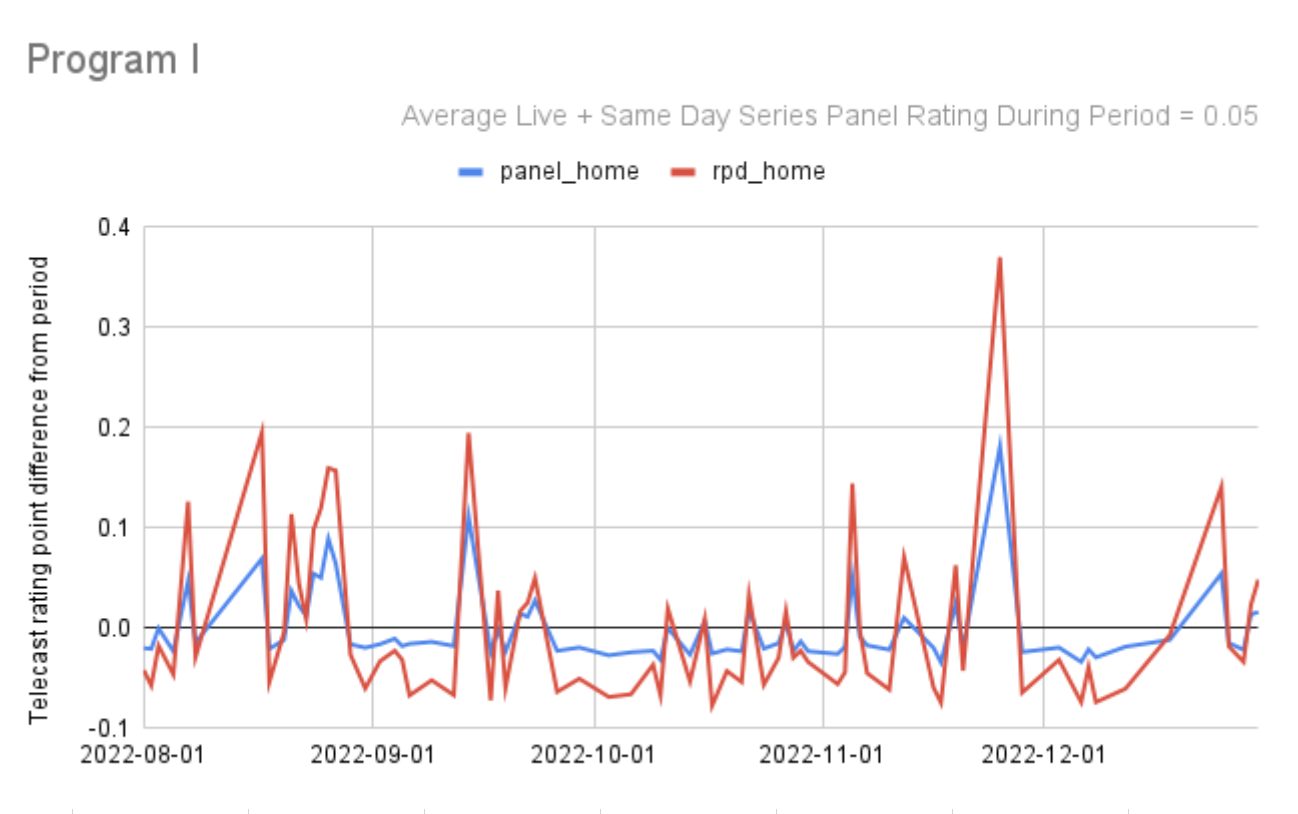
Here’s another:
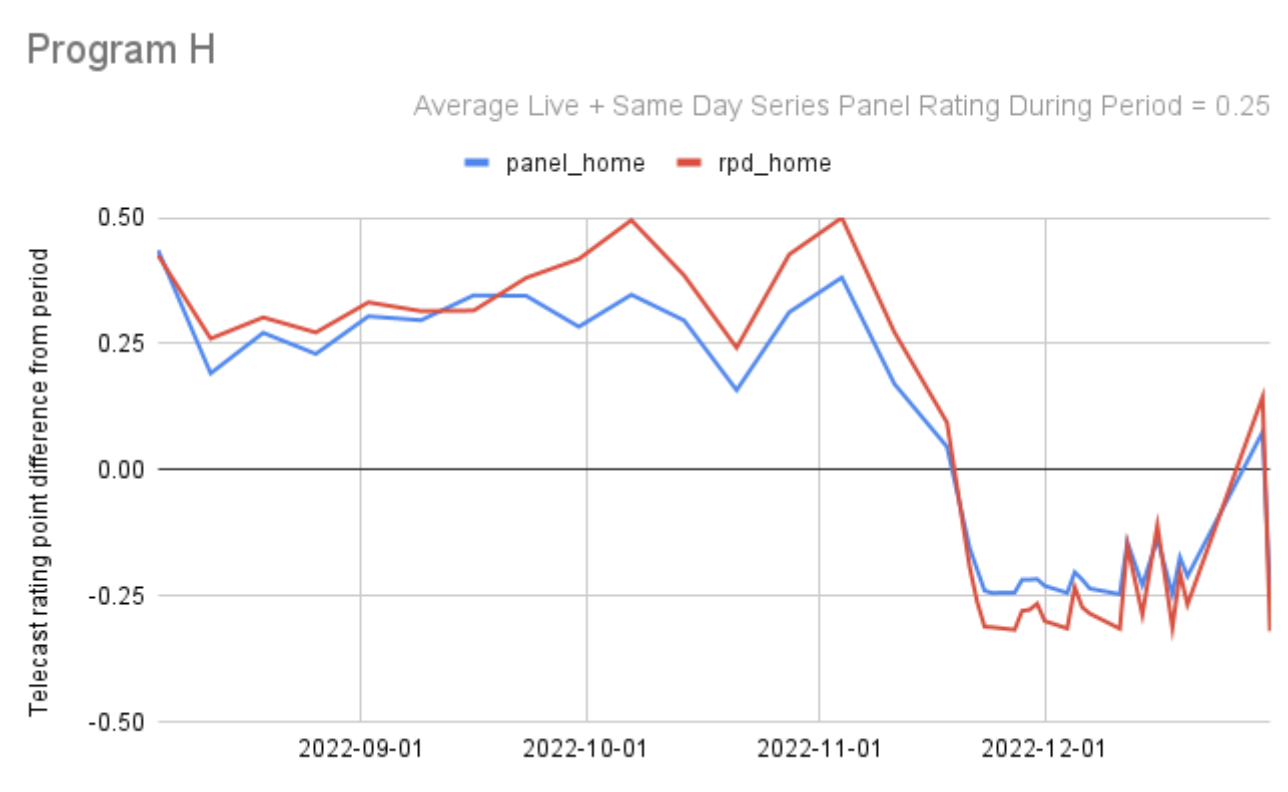
Here’s another:

Here are a few more:

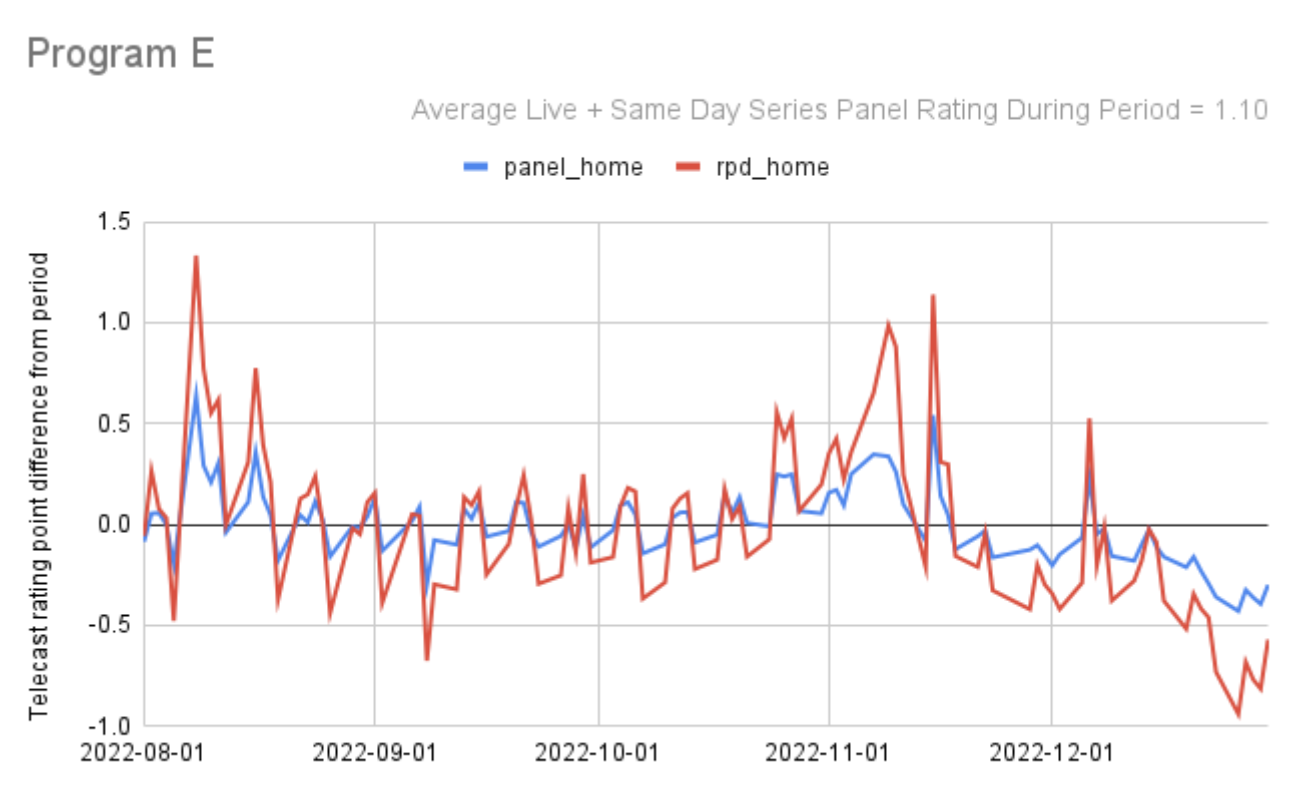

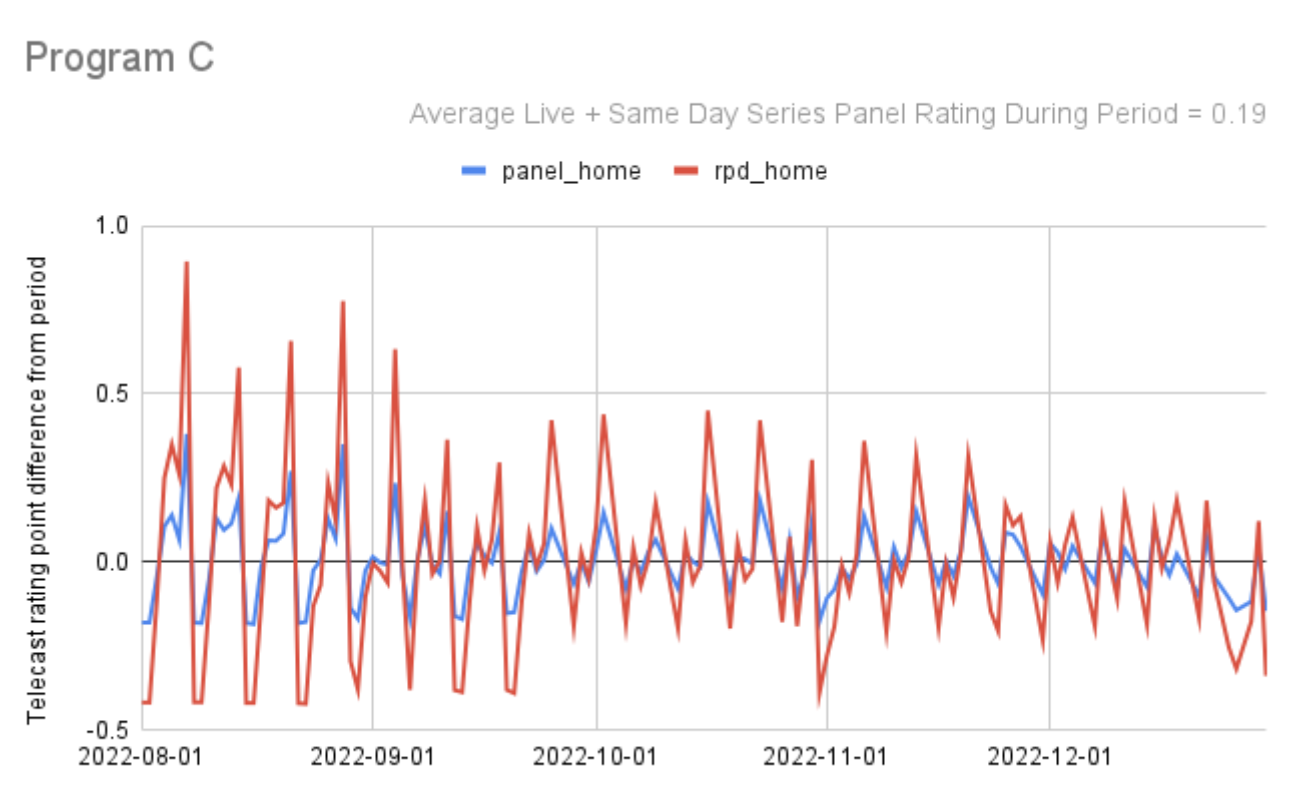
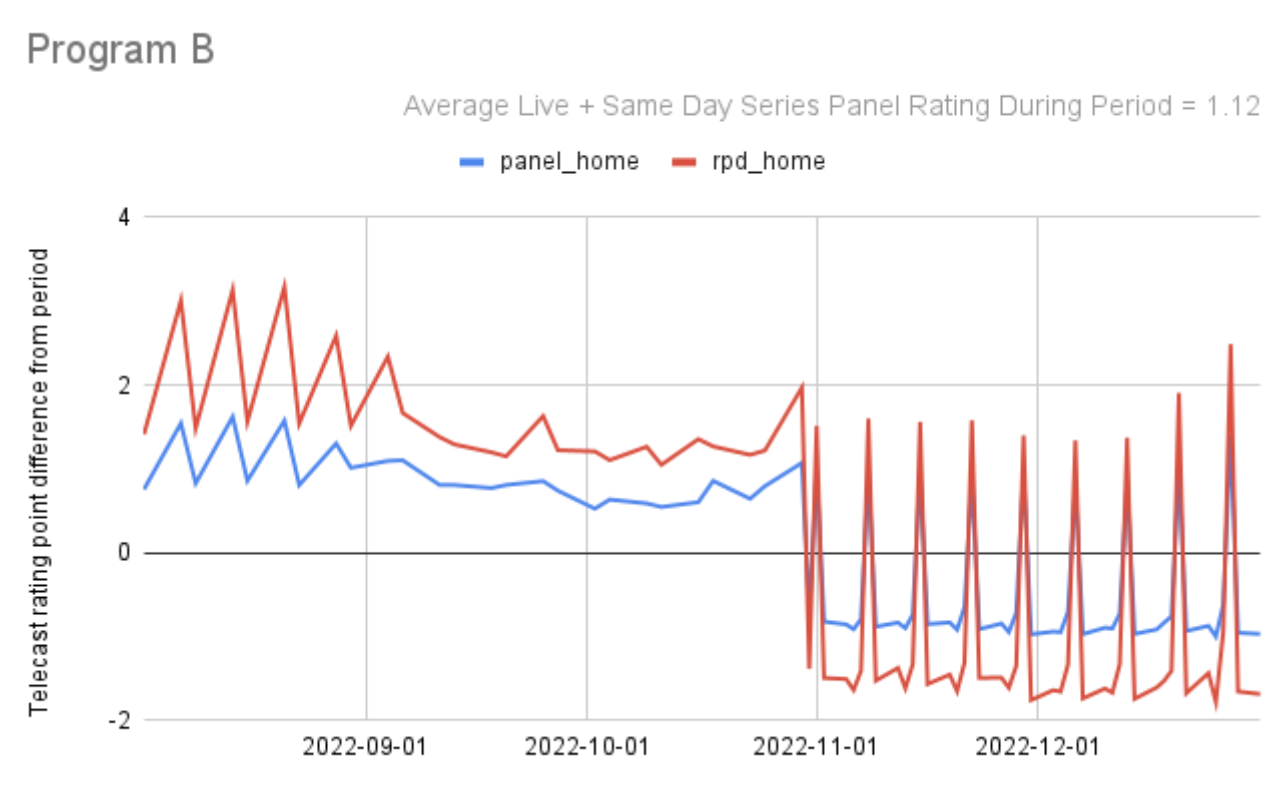

So far I’ve looked at 49 programs across 46 networks and the pattern of agreement between panel and set-top-box data in terms of the movements up and down in program ratings from telecast to telecast made me feel more confident than ever in the accuracy of both methods. Generally, when you see two signals moving in parallel, they are validating each other, there is a single truth being accurately measured by both of them.
Here are the summary statistics across all the 49 program series graphs:
- There were a total of 2885 rating change observations for each source across the 49 series. Half were daily shows and half were once a week shows. (We wanted to get as many observations as possible so we included daily shows as half the sample.)
- The telecast-to-telecast change was in the same direction for panel and STB 94% of the time.
- Another 1% of the time the two were almost parallel, but not going in exactly the same direction.
- The remaining 5% of the observations showed different directions of change.
- Despite a huge sample size advantage, STB changes were only slightly smaller on average than panel, which is another sign that these are mostly real changes, with only a small contribution from sampling errors:

The size of these changes from telecast-to-telecast strike one immediately as high instability; yet the fact that both methods move together suggest that they are both measuring the same underlying reality, and that in fact – at least in today’s era of more program choice than the average viewer’s mind can comprehend – the volatility from telecast to telecast in the real specific-program audiences is far greater than most of us have assumed.
The fact that national panel is almost as steady as STB (aka RPD) appears to indicate that almost all of the changes shown are real, since, as Nielsen’s Chief Research Officer Pete Doe says, “With sample sizes in the tens of millions, there is virtually no sampling error.” I agree. TRA only had a few million homes but there was virtually no sampling error.
The level of program rating change flattens out a lot when looked at on a month-to-month basis, as I’d asked Nielsen’s Peter Katsingris to track. Across 5911 series, the average month to month program rating change is 19.95% in the panel and 20.05% in the Impact data (panel + big data).
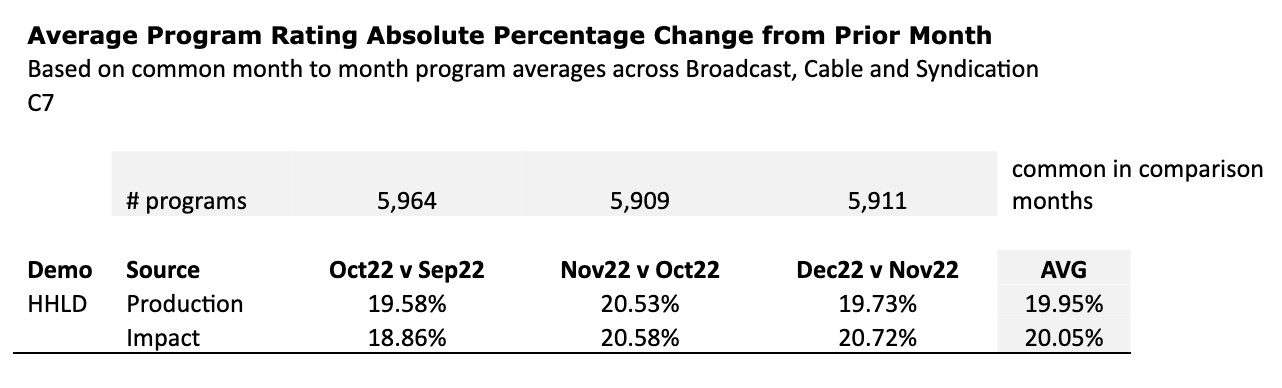
This analysis also verifies the average program rating change parity between panel (Production) and panel + big data (Impact). If the percent change is close between panel (~42,000 homes) and panel + big data (~30,000,000 homes) then the change cannot be coming from sampling error, because big data at that scale doesn’t have very much of that. That leaves the only possibility which is the obvious one, that (most of) these audience changes are real.
Nielsen is as committed to big data – both STB and smart TV, and server data for publishers who choose to make full integrations with Nielsen – as they are to their panels, because the combination is the right thing to do. That the industry still has national topline program level stability from the panel alone is good to know, but its stability won’t extend to demo breakouts, and it doesn’t prevent having some zero audiences, those two areas are where big data will add most of their value in national. In local, Nielsen is equally committed to apply the new integration solution there as well, and as soon as possible, because the pain of smaller sample sizes in this sort of fragmented media environment is much greater.
This stability finding is most unusual. What it suggests is that the ragged ups and downs of ratings, assumed to be the fault of high-quality area probability panels with their sample sizes in the tens of thousands or less, doesn’t mostly represent measurement instability at all, it represents swings in real audiences in and out of a program from week to week, because of the beckoning effect of immense choice. What we might call reality instability.
Key Takeaways:
- This article’s findings have no effect on the top priority given by Nielsen to achieving the maximum stability possible in its national and local currency services. It remains Nielsen’s top priority based on client feedback.
- Nielsen national panel and set top box data have excellent consilience in mirroring the vast majority of telecast-to-telecast rating change directionality and magnitude. This should give the industry more confidence in its audience measurement practices.
- The volatility in a television series’ actual audiences from telecast to telecast has not been a subject given much attention before, but it’s probably a subject worth studying, and affecting by means of continuous tune-in advertising for all series telecasts, not just premieres.
Self-published at MediaVillage through the www.AvrioB2B.com platform.
Click the social buttons to share this content with your friends and colleagues.
The opinions and points of view expressed in this content are exclusively the views of the author and/or subject(s) and do not necessarily represent the views of MediaVillage.com/MyersBizNet, Inc. management or associated writers.

Bill Harvey
Bill Harvey, who won an Emmy® Award in 2022 for his invention of set top box data, has spent over 35 years leading the way in media research with pioneer thinking in New Media, set top box data, optimizers, measurement standards, privacy standards, the A…