Nielsen ONE Ads Reveals How to Build Cross-Platform Reach Efficiently
Reach continues to be unanimously important to all marketers. As Erwin Ephron pointed out, bringing one prospect up from zero ad impressions to one ad impression increases incremental aggregate sales probability far more than bringing anyone already reached up by one more impression of frequency. (Editor's note: As noted below, Bill Harvey is a paid consultant focused on optimizing the combination of big data with all other Nielsen methodologies.)
Reach used to be easier to achieve because there were fewer vehicles to choose from, each with a much larger audience than the audiences of today. P&G’s "Comprehensives" -- a set of Nielsen special reach/frequency tabulations for all kinds of linear TV schedules -– taught we who were lucky enough to work for a P&G agency that having even just one high-rated program in a schedule assured a higher reach campaign than if all the vehicles were low rated but added up to the same GRP*.
A national advertiser would focus 90% of media attention on a few hundred TV shows and fewer than a hundred magazines. Today a brand might implicitly consider nearly a hundred video platforms containing over 100,000 programs, as well as thousands of digital alternatives, audio, out of home and print. With the possible exception of major live sports, each vehicle today has a tiny audience by the standards of the Mad Men era -- making it virtually impossible to achieve the same reach at equal GRP, relative to the good old days. Today, the conditions demand that practitioners study the devilish details and find the magic solutions that enable more reach. Hence this article. Here we will disclose findings that will make it possible to achieve 90% reach. In contrast to using only the tricks of the trade handed down from the halcyon past, and not the new tricks taught by Nielsen ONE, where you would only get 70% reach for the same money.
Nielsen ONE has over 45,000 campaigns we can all learn from. I’ve been studying a random 2267 campaign sample as part of my paid consultancy aimed at optimizing the combination of big data with all other Nielsen methodologies. The big conclusion I’ve drawn so far is that the old trick of assuming random duplication as a fair estimate of reality no longer works as well. There are definitely non-random patterns of duplication which can make a significant difference. It would be an unusual mistake for the World Federation of Advertisers (WFA) and the Association of National Advertisers (ANA), et al, to go down a path of using random duplication as a minimum standard for audience measurement. This had been their announced plan in 2019 and hopefully minds have been changing these last four years. 2023 Ephron Award winner Artie Bulgrin had taught us with his Project Blueprint that across media types, the duplication patterns are nonrandom, complex, and must be measured empirically by a probability sample panel. The industry has to reflect upon these lessons or they will need to re-learn everything all over again the hard way.
The way Bill Harvey Consulting is doing these analyses, we do not know the brands involved, nor do we know their actual targets. Only the brand itself can see their own campaigns in complete detail with nothing held back, and can empower its agencies to also have that access. For purposes of these analyses, we are using adults 25-54 as the target. The GRP and reach numbers we cite are against that population.
Let’s take two campaigns that were relatively large – both around 3500 GRP (one was 3505 GRP and the other 3464 – a one percent difference). Both of them used linear TV, CTV, and mobile. One of them also used computer.
The one with the fewer GRPs got the higher reach of the two campaigns. It achieved 91.47% reach.
The one with slightly more GRPs accomplished only a 73.66% reach.
Now let’s peel the onion.
Here’s a comparison of the media mix used by the two campaigns, expressed in terms of percent of GRPs:
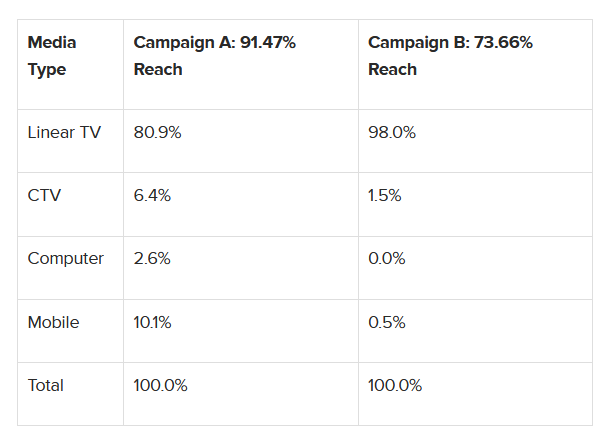
The mistake here is pretty clear: Campaign B used only trace amounts of the three other media types, the campaign was the closest thing to a straight linear TV buy. Woeful underuse of the three media types for reach maximization.
Let’s take a look at two other campaigns at a slightly lower GRP level – Campaign C with 2247 GRP, and Campaign D with 2010 GRP, a little over 10% smaller. Both of these campaigns used all four media types. Campaign C achieved a reach of 85.96% while Campaign D reached only 61.64%. Campaign D had about 89% of the GRPs of Campaign C, but obtained only 72% of its reach. Why?
It was not because of a big difference in media mix, as in the prior case, because in this case, the two media mixes were reasonably similar in terms of percent of GRPs:
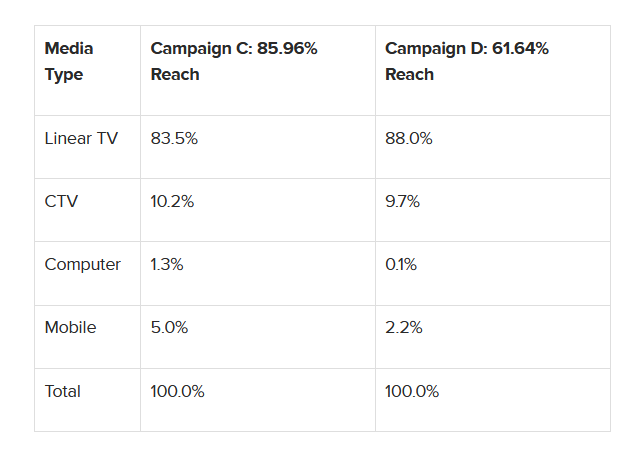
So, how can we explain why Campaign C received more than 24 more reach points than Campaign D?
Dispersion. The number of different publishers used:
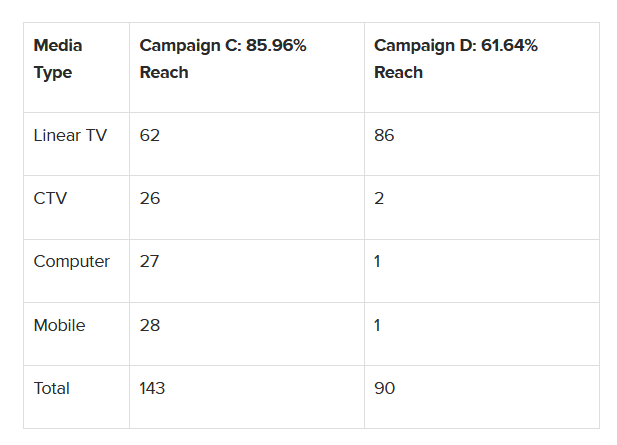
Campaign D actually used more networks in Linear than Campaign C did. The reason why Campaign D lagged far behind Campaign C in reach was because dispersion was not used by Campaign D in digital, although it was used in linear TV. Being an even lower reach per campaign medium, with even smaller audiences to any given content than linear, the need for dispersion is logically even greater in digital. Though arguably risk exists in dispersion that is too great. For example, including environments that do not amplify the ad, or platforms which dilute good targeting. In a word, delicate integration of many factors.
It has always been known that dispersion is mission critical for maximizing reach. In radio, the learning was to buy “deeper” i.e., more stations per market. In linear, the learning was to buy more networks across more dayparts. Now, in cross-platform, the learning is that you have to use dispersion within every media type carefully and prudently - which I will discuss in our next piece.
There is a wealth of learning still to come as I’m just scratching the surface of Nielsen ONE. Stay tuned for further articles in this series.
*GRP=Gross Rating Points=the number of ad impressions divided by the size of the population targeted, times 100. Thus, one million ad impressions against a target population of one million people=100 GRP.
Posted at MediaVillage through the Thought Leadership self-publishing platform.
Click the social buttons to share this story with colleagues and friends.
The opinions expressed here are the author's views and do not necessarily represent the views of MediaVillage.com/MyersBizNet.

Bill Harvey
Bill Harvey, who won an Emmy® Award in 2022 for his invention of set top box data, has spent over 35 years leading the way in media research with pioneer thinking in New Media, set top box data, optimizers, measurement standards, privacy standards, the A…