Nielsen Optimizes Cross-Platform Reach Measurement

Since 2019, the World Federation of Advertisers, the Association of National Advertisers, the Incorporated Society of British Advertisers, and the advertiser associations in 58 other countries have been focused on being able to accurately and precisely measure the reach and frequency of their ad campaigns across television and digital.
Since 2019, the World Federation of Advertisers, the Association of National Advertisers, the Incorporated Society of British Advertisers, and the advertiser associations in 58 other countries have been focused on being able to accurately and precisely measure the reach and frequency of their ad campaigns across television and digital.
Nielsen ONE Ads was launched on January 11, 2023, to meet this need in the US. Tens of thousands of campaigns have been measured so far. Because my consulting for Nielsen grants me access to their data, in this column I’ve examined what the industry can learn from the patterns reported here from across the first ~45,000 campaigns measured. We’ve noted that dispersion across more publishers and platforms enables a campaign to gain as many as 20 more reach points compared to campaigns which are very focused on just a few of the most obvious media choices. We’ve shown that linear is still the essential reach driver, but CTV, mobile and computer need to receive significant allocations as well. In our reporting here, made possible through my consultancy for Nielsen, so far we’ve concentrated on reporting findings rather than writing about methodology.
In this article I’m going to focus on some methodology work that Nielsen has done which I feel is worthy of public attention. As a researcher myself I cannot help but call out what I consider to be great accomplishments in data science. Nielsen presented this methodology at the ARF annual AUDIENCExSCIENCE 2025 conference in March and has just written it up as a paper soon to be released. I will draw excerpts from that paper as a preview here for a general audience of media leaders.
First let’s note a few special problems in measuring reach/frequency across an immensely fragmented sea of diverse media types in a way that addresses the business and workflow needs of all players in the ecosystem, advertisers, agencies, and media sellers.
For any audience research company in any country, there will be a currency that until now has been for linear television. Linear is now only one of a number of types of television (VOD, streaming/CTV, Addressable TV, TV on mobile devices, TV on computers, IPTV/ATSC 3.0) and a zoo of digital types. The methods of measuring cross-platform must cover all of these. That methodology cannot be identical to currency. And yet if its results do not correspond to currency for linear and streaming/CTV, the marketplace breaks.
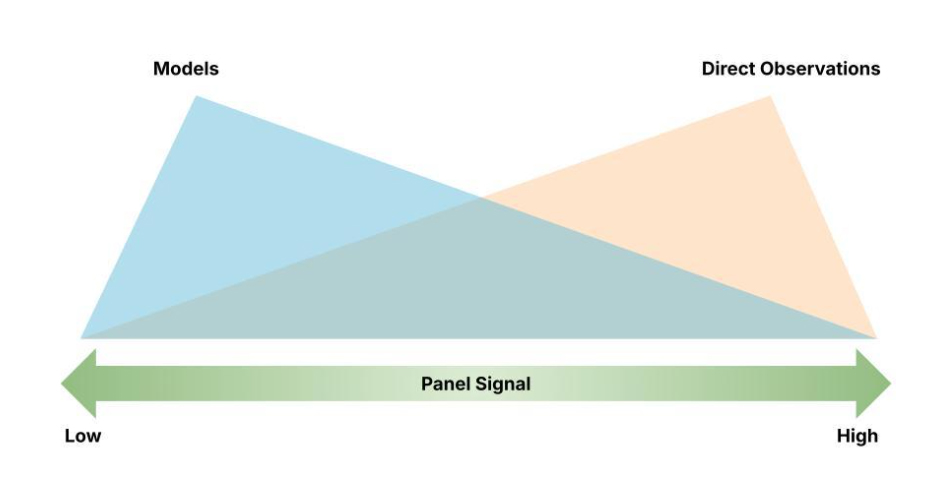
Outcomes are where the market is moving. In order to ensure the best ROAS and branding outcomes, the new paradigm requires inflight reoptimization, meaning dropping certain nonperforming ads and media, and shifting budgets to what is working. Thus, a cross-platform measurement system must be able to work from initial data collections which are likely to be sketchy. Remember that the ratings which used to average 18.0 in primetime are now in the vast majority of cases down in the 0.XXX three decimal places range. No matter how big the panel and the big data array, with fractionated audiences the first day of a campaign is going to provide data that is going to misrepresent the cumulative findings across the first week, much like the early results of an election do not accurately predict the final tally.
These are among the real-world concerns which the Nielsen data science, engineering and product teams took into careful consideration in coming up with the elegant methodological solution we’re about to describe. I’ll now be providing excerpts from the paper.
A. The Foundation: Nielsen's Single-Source Panel - The Ground Truth
At the heart of Nielsen ONE Ads' accuracy is Nielsen's robust single-source panel. This isn't a theoretical model; it's a direct observation engine.
- Rich, Comprehensive Data: In the US, nearly 27,000 TV homes, encompassing approximately 67,000 panelists, are equipped with Nielsen Streaming Meters that capture digital behavior alongside traditional TV meters. This provides a holistic view of media consumption at the household and individual level.
- Person-Level Insights: Crucially, mobile and computer devices within these panel homes are mapped to individual panelists. This person-centric approach allows for proper attribution of digital impressions, accounting for nuances like device sharing or co-viewing within a household.
- Direct Observation of Duplication: By combining metered TV data with matched digital impressions (either through streaming meter data or panelist matches for certain walled gardens), the panel directly captures respondent-level ad exposures across platforms. This provides an unbiased, empirical source of truth for how actual audience duplication occurs for individual campaigns, with data processed daily.
This single-source panel is the bedrock, providing the direct observational data essential for truly understanding cross-platform behavior.
B. Dynamic Deduplication: Blending Direct Observation with Modeled Intelligence via Bayesian Inference
While direct observation is vital, Nielsen ONE Ads enhances this with intelligent modeling, leveraging the power of Bayesian inference to combine multiple streams of information for the most robust estimate.
- Two Key Inputs:
- Direct Observations (The "Panel" Step / "Likelihood"): Campaign-specific ad exposures captured directly from the single-source panel provide granularity and reflect the unique characteristics of that campaign.
- Modeled Expectations (The "Expectations" Step / "Prior"): Nielsen leverages rich historical data from tens of thousands of cross-platform campaigns run since early 2022. This data is used to train models that provide expected duplication rates, offering stability to the estimates, especially when panel observations for a specific campaign might initially be sparse.
- The Bayesian Advantage: Instead of relying on just one source, Bayesian inference intelligently weighs and combines both the campaign-specific panel data (likelihood) and the historical modeled data (prior). The result is a "posterior" distribution – a final, more accurate and stable estimate of duplication.
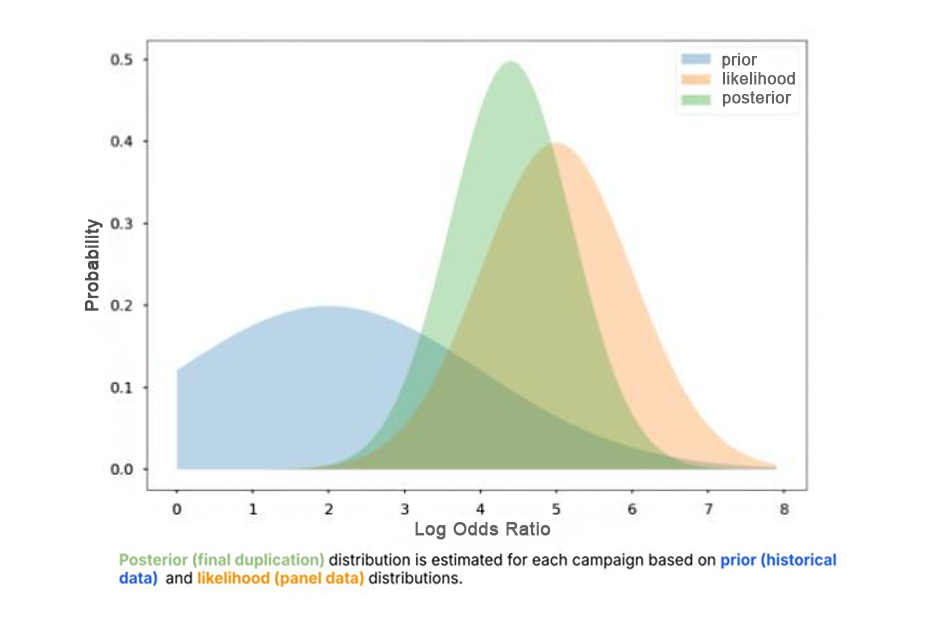
Figure 4: Example likelihood, prior, and posterior distributions for a given cross-platform duplication rate. The use of a Bayesian framework ensures that both the historical data and campaign panel data are used to their fullest in the estimation of duplication rates.
- Dynamic Weighting: This isn't a static calculation. The influence of the panel data versus the historical model is dynamic.
- For campaigns with a large volume of panel observations (high panel signal), the system leans more heavily on the direct, campaign-specific data.
- For smaller campaigns or at the beginning of a campaign when panel sample observations are still accumulating, the historical models provide a stable and reliable starting point.
- This weighting continuously updates daily as more panel data becomes available for a campaign.
This dynamic, data-driven approach ensures that Nielsen ONE Ads maximizes the utility of all available information, balancing the stability of historical trends with the specific nuances of each individual campaign.
C. Ensuring Coherent and Consistent Reporting: The Alignment Step
Obtaining accurate duplication insights is one part of the equation; ensuring these insights are reported consistently and make logical sense alongside established platform metrics is equally critical. Nielsen ONE Ads incorporates a rigorous alignment process.
- Alignment with Platform Totals: The deduplicated audience estimates are carefully aligned with Nielsen's trusted Television Audience Measurement (TAM) and Digital Ad Ratings (DAR) platform totals. This ensures that the cross-platform view is coherent with the currency numbers clients already use.
- Statistical Optimization for Consistency: To maintain consistency across all reporting levels (e.g., from individual placements up to the total campaign, and across different audience segments), Nielsen ONE Ads employs sophisticated statistical algorithms:
- Maximum Entropy: This principle is applied at each level of reporting granularity (e.g., "horizontally" across the different screens like TV, CTV, Computer, Mobile). It ensures that the estimated duplication rates align with the total audience recorded for each screen in a way that introduces the least possible bias when information doesn't uniquely determine a distribution.
- Linear Optimization: A separate optimization step is then applied "vertically" across reporting granularities. This ensures, for example, that the sum of audiences for individual placements logically rolls up to the site level, which in turn rolls up to the total platform level, and that these all relate coherently to the total cross-platform audience.
These meticulous alignment and optimization steps ensure that the millions of estimates produced for any given campaign are not only accurate in isolation, but are also self-consistent and interrelated, providing a trustworthy and logical foundation for decision-making.
Let's examine the evidence from actual campaigns:
A. Discrepancies in Unique Audience and Overlap Patterns
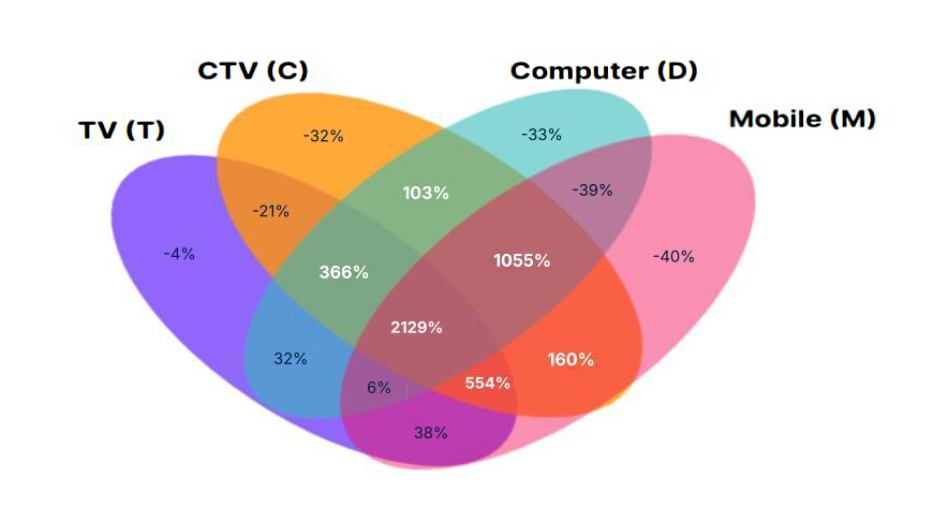
Visualizing the audience distribution across platforms immediately reveals stark contrasts. Consider two masked four-screen campaigns from 2024:
Campaign 1: Higher Observed Duplication by Nielsen ONE Ads In this first example, Nielsen ONE Ads, by observing actual audience behavior, identified higher rates of duplication across platforms than the independence assumption would predict. This resulted in a total unique audience (UA) that was 6% smaller than what the independence assumption suggested. For a campaign with approximately 134 million total unique viewers as measured by Nielsen ONE Ads, this 6% difference translates to about 8 million fewer unique individuals compared to the independence estimate - equivalent to the population of New York City or Washington State! In this scenario, relying on the independence assumption would have significantly inflated the perceived reach of the campaign.
Campaign 2: Lower Observed Duplication by Nielsen ONE Ads In a second campaign from the same timeframe, the situation was reversed. Nielsen ONE Ads observed lower rates of actual duplication, leading to a total unique audience that was 3% larger than the independence assumption. For this campaign, which had a total unique audience of 217 million as per Nielsen ONE Ads, this meant Nielsen reported approximately 6 million more unique individuals than independence would have. Here, the independence assumption would have led to an underestimation of the campaign's true reach, potentially causing advertisers to undervalue its impact or miss opportunities.
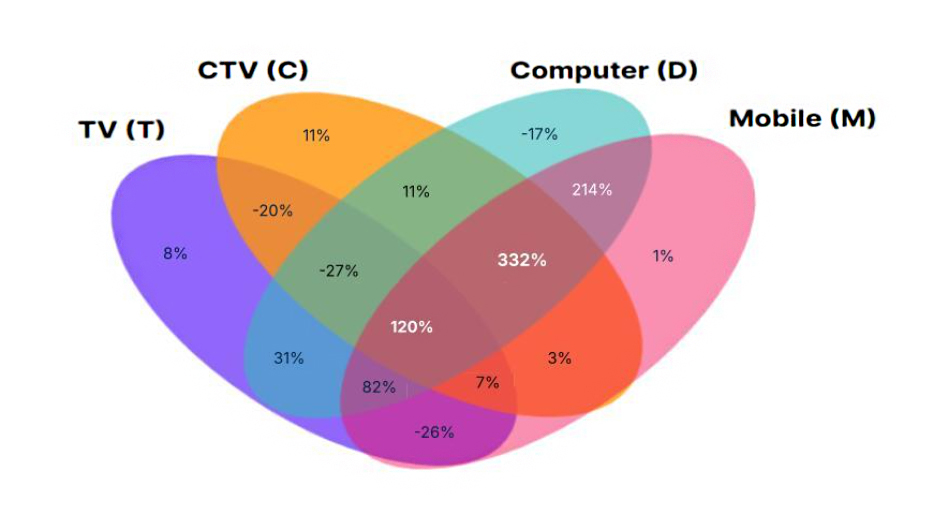
These individual campaign snapshots illustrate a critical point: the independence assumption is not consistently biased in one direction. It can lead to either overstatement or understatement of reach, making it an unreliable tool for decision-making. When attempting to understand the duplication between specific components, the relative error range is often far greater than at the campaign level.
The new media ecological landscape is far more difficult to precisely measure than it was when some of us first got into the business, and it will continue to become more complex from now on, with Virtual Reality (VR), Augmented Reality (AR), AI Agents that read a person’s EEG and eventually fMRI as widespread as today’s Apple Watches and Fitbits and bring new media content to that person to maximize desired moods, and eventually 3D haptic VR that is a deepfake of reality. Keeping up with all of it will be dedicated media researchers who truly care about accuracy and are kept awake at night figuring out solutions.
Posted at MediaVillage through the Thought Leadership self-publishing platform.
Click the social buttons to share this story with colleagues and friends.
The opinions expressed here are the author's views and do not necessarily represent the views of MediaVillage.org/MyersBizNet.

Bill Harvey
Bill Harvey, who won an Emmy® Award in 2022 for his invention of set top box data, has spent over 35 years leading the way in media research with pioneer thinking in New Media, set top box data, optimizers, measurement standards, privacy standards, the A…