Projecting Big Data Beyond Its Own Footprint

In television, there are two types of big data currently being licensed for use in audience measurement: return path data (aka set top box data) and smart TV automated content recognition (ACR) data. The Media Rating Council (MRC) has established a standard indicating that these data types ought to be used only to represent their own user base, and not represent the entire U.S., but it is currently reviewing that standard, and this article might be useful to MRC in considering in what ways that standard might be expanded.
The significance of this standard is that TRA, my former company now owned by TiVo, was acting outside that standard by projecting Charter set top box data plus TiVo data to homes outside the Charter and TiVo footprints. In fact, we were projecting the data from these two sources, with appropriate geographic and demographic weighting, to total U.S. TV homes. We were satisfied based on the information available to us -- which indicated that our numbers correlated .9533 with Nielsen and that what we were doing was useful and actionable -- as were 77 direct brand clients and most of the top agencies and networks.
Clients such as Dave Poltrack at CBS were quick to point out that high correlation did not mean close agreement on each program, to which I would agree, adding that TRA did not exist to replace Nielsen as the source of precise audience data, but to measure ROI, which we seemed to be able to do quite well at less granular levels such as daypart, TV vs. digital, frequency, creative executions, target groups and so on.
In fact, today a number of companies similar to TRA are coming up in the field, and they too project the two current types of TV big data to total U.S. TV homes. However, they are stating their main purpose as replacing Nielsen as the most precise and unbiased source of audience data.
Unlike TRA and the new set top box and smart TV data analytics companies, Nielsen, which uses about 30 million U.S. homes' worth of the two big data types in its already-active national big data + panel service to officially launch this fall, projects the data only to the subset of the four providers' own footprints in which they are able to collect household level tuning data, per the current MRC standard under review. This ensures that no bias can result since no household is projected to anyone other than itself.
While this minimizes risks of bias, the approach limits the degree to which big data can improve report-to-report stability, because it limits the weight given to big data. Wishing to explore this open-mindedly, Nielsen, with MRC encouragement, decided to conduct a series of analyses to gauge if some degree of projection beyond provider footprints could provide the combination of both optimal unbiased and stable estimates.
Recently, Marty Frankel, a leading industry statistical expert who has been involved in the past helping Nielsen and MRC, and myself were engaged by Nielsen to contribute to a broad sweep reinvention of Nielsen methodology to get the most value out of the combination of big data and panel, and this question of "projection beyond provider footprints" became our first project.
One of the ways we've been looking at this is simply to use Nielsen's own panel as a way of studying which of our big data sources (based on the part that is in the panel) has the greatest similarity in viewing behavior with larger swaths of the population. In other words, how well can one smaller segment represent another, larger segment.
To start with a simple example, can homes with connected smart TVs within over-the-air homes (no cable nor satellite subscriptions, just antenna, aka OTA) accurately represent the viewing of all OTA homes? The following charts reveal that there are some serious differences within current Nielsen panel currency between the total OTA population and the subset of the OTA population that have ACR enabled (i.e., connected to Internet) Vizio or Roku TVs.
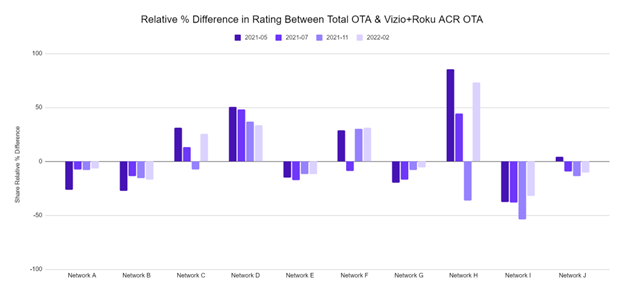
Obviously, the above differences in network ratings are too large (including some in the 50-100% difference range) for Nielsen to consider this method. There are clearly behavioral differences between the two cohorts that would make it inappropriate to represent the total with the smart TV ACR subset.
It's possible but unlikely that weighting by geography and demography could cause the numbers to fall into line, given that the viewing differences are larger (5% to 80%) than these geodemographic differences (0% to 11%) between the smart TV ACR OTA cohort and the total OTA cohort, as shown below.
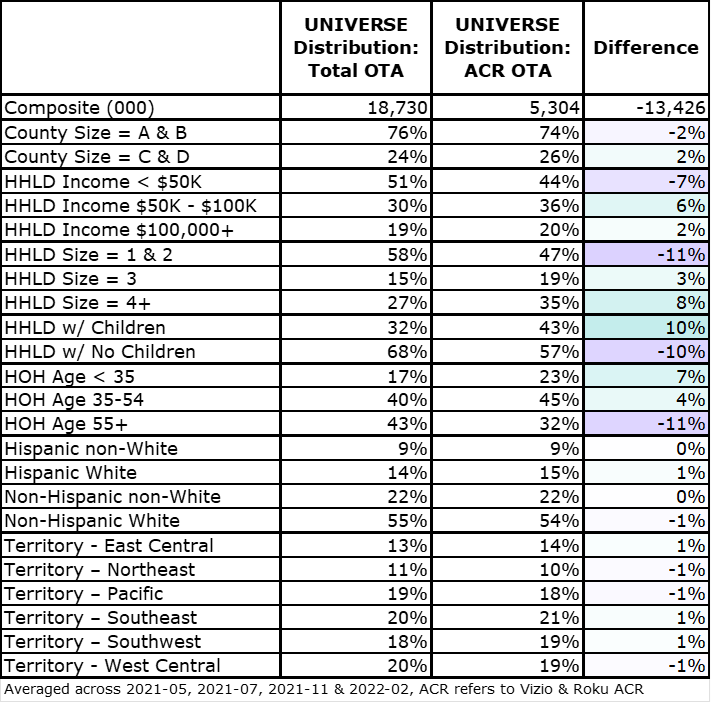
Large viewing differences exist because big behavioral differences exist between those who purchase a smart TV maybe as an alternative to sling or YouTube TV and hook it up to the internet and also use an antenna to source live network TV, versus those who can only afford to watch a traditional set with bunny ears. The sharply divided spectrum of OTA users is why using one end of the spectrum to speak for all would not be appropriate.
As you can see, we've moved into a new era in audience measurement in the U.S. in which the leading research company is opening its doors to transparent collaboration with clients and the MRC to optimize how big data and panel data can work together for the most valid and stable audience estimates possible. Stay tuned for more news from this front, and we welcome your input.
Click the social buttons to share this story with colleagues and friends.
The opinions expressed here are the author's views and do not necessarily represent the views of MediaVillage.com/MyersBizNet.

Bill Harvey
Bill Harvey, who won an Emmy® Award in 2022 for his invention of set top box data, has spent over 35 years leading the way in media research with pioneer thinking in New Media, set top box data, optimizers, measurement standards, privacy standards, the A…