Taking a Walk on the Measurement Wild Side

Nowadays, you can't get through the media day without being bombarded with a ton of headlines touting the millions of views that a video is delivering on some digital entity. Candace Payne's Chewbacca mask live video garnered over 164 million views, the most-watched Facebook Live video of 2016. BuzzFeed's 2020 presidential election countdown clock earned more than 51 million views. It's enough to think that digital video viewership has surpassed traditional TV. But, while online viewing is growing, Nielsen's most recent Comparable Metrics Report shows that live and time-shifted TV viewing continues to account for more than 92% of all video consumption in the U.S.
In our increasingly fragmented world, the industry still does not have a universally-adopted currency measurement system that incorporates cross-platform viewing. The variety of digital metrics such as starts, views and reach don't exactly sync up with TV terminology and definitions we've been using for decades. Unfortunately, this creates a lot of confusion whereby people mistake video starts on digital with average-viewing-minute audience on TV.
Let's take one of the more noteworthy examples from the past few years. You may recall that back in the fall of 2015 the NFL teamed with Yahoo to produce the first live-streamed NFL game between the Buffalo Bills and Jacksonville Jaguars. The next day, headlines from Yahoo and the NFL screamed, "Yahoo livestream of Bills-Jags attracts 33.6 million views." Another headline about the same event touted, "The NFL's First Live-Streamed Game on Yahoo Attracted Over 15 Million Viewers."
Let's translate this into TV lingo.
At the time, several reports mistakenly compared the 15.2 million "uniques" with "around 20 million [who] tune in to watch when [an NFL] game is aired in the afternoon on CBS or Fox." But this 20 million stat is an average-minute audience delivery. Instead, the 15.2 million "uniques" for the Bills-Jags game most closely matches the "reach" statistic for TV, which is unduplicated persons watching all or just a portion of the event. The average Sunday afternoon NFL game on CBS in October 2015 "reached" 49.0 million viewers on a Live+Same Day basis.
In addition, the "uniques" stat includes folks who may have watched for a split-second on digital, whereas the threshold for the CBS "reach" is a minimum of at least one minute of viewing. This distinction is important because the Bills-Jags game was featured across the suite of Yahoo-owned properties and the stream played on auto-start, which meant that it counted people who simply were just signing into their Yahoo.com personal homepage and who may have had no interest in the game.
To translate Yahoo's viewership into the traditional average-minute audience often used to evaluate TV delivery, you basically need three pieces of information. How many total minutes those streams accounted for, how many minutes the event lasted and what percentage of the total minutes originated from folks in the U.S. Equipped with this intelligence, you can derive the most fair comparison between digital and TV. Notice that the often-quoted "uniques" and "streams" statistics are not essential to calculate average audience and typically serve as attention-grabbing distractions. In the Bills-Jags example, the eventual average-minute viewership in the U.S. was about 1.6 million viewers.
Similarly, last fall's inaugural Thursday Night Football on Twitter between the New York Jets and Buffalo Bills scored 2.1 million unique viewers worldwide. Viewership was smaller than the 2015 Yahoo game mainly because the Jets/Bills contest was also telecast on CBS and NFL Network. Translating the 2.1 million uniques into a comparable average-minute delivery resulted in an average 243,000 viewers worldwide. Comparatively, the game averaged 18.8 million viewers on CBS (15.4 million) and NFL Network (3.4 million).
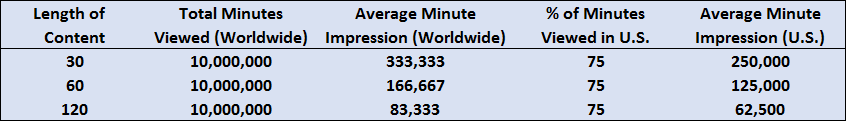
So, here's a rule-of-thumb guide. For a 60-minute video, every 10 million viewing minutes equates to 166,667 average-minute impressions. If the video is just 30 minutes then every 10 million viewing minutes represent twice the average minute impressions (333,333), and if the video is 120-minutes then the 10 million viewing minutes translate into half that of a one-hour video (83,333). If just 75% of the minutes come from someone in the U.S., then the average minute U.S. delivery falls to 125,000 impressions, 250,000 impressions, and 62,500 impressions, respectively.
Click the social buttons above or below to share this story with your friends and colleagues.
The opinions and points of view expressed in this content are exclusively the views of the author and/or subject(s) and do not necessarily represent the views of MediaVillage.com/MyersBizNet, Inc. management or associated writers.

Don Robert
Don Robert is Executive Vice President, Research & Insights at A+E Networks. He has been leading the research group across all A+E Networks divisions since 2014. Earlier this year, the team expanded to include five distinct areas to provide m…