The Biggest Shift in US TV Audience Measurement Methodology in History

For the last 75 years, the national television audience measurement currency has been based on an area probability sample panel using metering technology and delivered by the Nielsen company, which is one of my consulting clients.
This year, with MRC Accreditation and a vote by Nielsen clients, the shift was made to a far more complex methodology integrating panel data with big data (BD) collected through set-top boxes, smart TVs, and direct integrations with media partners’ server data. The big data were carefully edited, where panel and big data were collected from the same device; the Nielsen meters were taken as more accurate than the BD, and new methods were developed and refined to adjust for missing data in the smart TV BD, mostly due to channels and programs that were not tracked. All of these data were statistically combined to provide the weights that science required.
Science also provides a Z Test as a means of determining how much to expect the differences to be between different samples. The Z Test in this case, based on assessing the differences versus the sampling variation inherent in the panel measurement across 174 networks, predicted that there would be more difference between the old and new Nielsen methods than actually appeared.
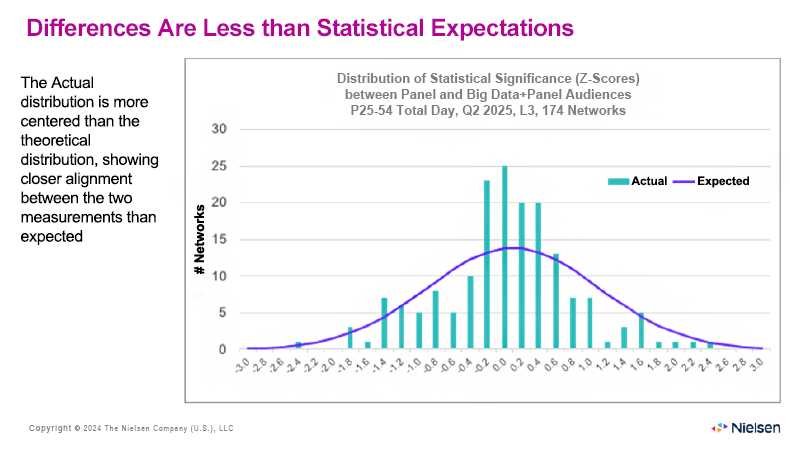
The preponderance of Z-scores closer to zero than a normal distribution shows that the two measurements are more closely aligned than expected, given the inherent sampling variation in the panel measurement.
Here is a more detailed look at the data:
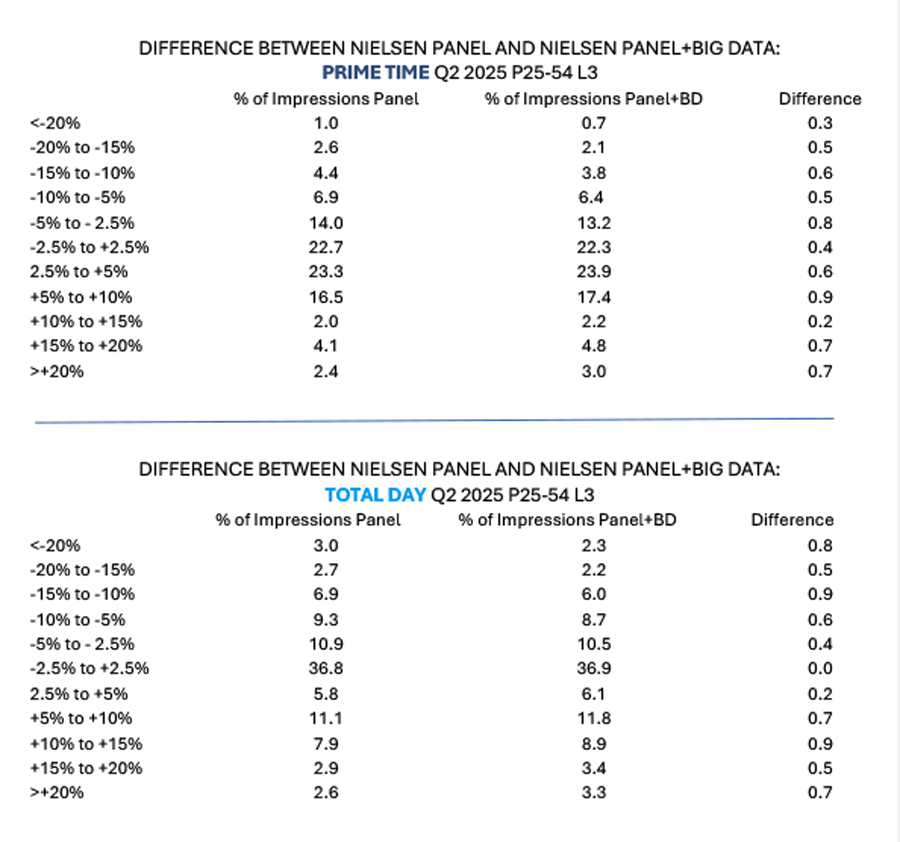
As you can see, the differences between the old methodology and the new one tend to be quite small, smaller than the cumulative wisdom of statistical science would have led one to expect.
However, with audiences shifting from linear to streaming television, causing economic shakeups, and even more fragmentation of audiences than already existed, networks are even more sensitive today than they have always been about any lowering of their audience numbers. It was inevitable that some networks would find their new numbers to be lower with the new method than with the old method. Out of 174 networks reported, 15 networks went down by 20% or more on an all-day basis, and 11 went down by 20% or more on a prime-time basis. These were smaller networks, so that the impressions drop from this group of 15 networks represents only 0.3% of all prime-time impressions and only 0.8% of all-day impressions.
Something else happened that had not been anticipated. Nielsen nowadays always provides “impact data” in advance of making any major methodological changes. The impact data that had been provided and had been used by the industry in the year leading up to the change showed that the BD would have the effect of increasing the ratings slightly. However, over the course of that year, some ratings in the BD slowly declined to under that of the panel, whose ratings declined less. These were very small changes, but television now has very low ratings (except for sports and a handful of tentpole exceptions), and so any changes become important. (TV’s ratings are still much higher than digital’s. The culture has become fragmented, driving the media fragmentation: we no longer all want to watch the same thing at the same time, with sports and a few other exceptions. It’s not TV causing it, it’s us.)
Looked at from the viewpoint of a professional media researcher, and accepting that there is no truth standard against which to compare ratings, this shift that Nielsen made was as good as any such change could get. The numbers are so close that one might jump to the conclusion that Nielsen conformed the data, forcing it to come out this way, but that was not the case, as confirmed by the MRC.
The networks that got hit by the change of course complained to Nielsen. Nielsen focused on examining the methodology to look for every possible way to improve the calculations that would help those networks, and found that any change would merely hurt other networks instead, and could not be justified based on self-evident superiority of method.
Exclusive Adjustments to Big Data
One might think, from the closeness of the panel-only vs. the panel+Big Data numbers, that the raw big data on its own might be coming very close to the panel data, even without all the corrections and filling of data gaps that Nielsen performs. However, this is not the case, as shown by the following chart, which shows how different the numbers would be without these Nielsen special procedures:
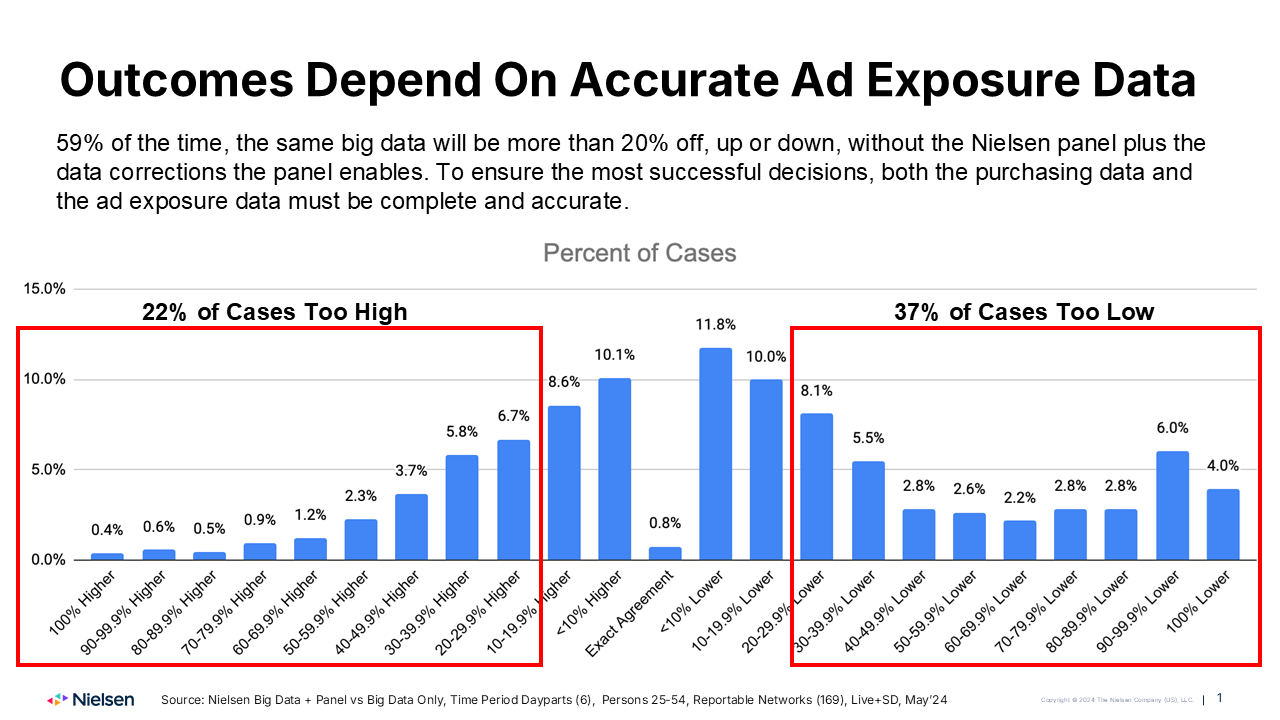
The largest effects of the Nielsen methodology seen in the above graph come from the Nielsen streaming meter, in ~26,000 of the national panel homes. This technological invention is what powers the popular Gauge, the currency for the streaming networks, and is the industry’s only source of viewing data on streaming, the most dynamic part of television today, accounting for 47.3% of all viewing. Most streaming networks do not allow the smart TVs to measure them, and set-top boxes cannot measure them either. Other large effects of the Nielsen corrections and completions to big data include omission of large numbers of television programs by smart TVs, undercounting of time shifted viewing by smart TVs, errors in program logs used in set top box data (such as when sports events run overtime), TV sets not measured at all in homes with some smart TV sets and some other TV sets, and of course the viewing by people in the big data homes.
Posted at MediaVillage through the Thought Leadership self-publishing platform.
Click the social buttons to share this story with colleagues and friends.
The opinions expressed here are the author's views and do not necessarily represent the views of MediaVillage.org/MyersBizNet.

Bill Harvey
Bill Harvey, who won an Emmy® Award in 2022 for his invention of set top box data, has spent over 35 years leading the way in media research with pioneer thinking in New Media, set top box data, optimizers, measurement standards, privacy standards, the A…