The Ongoing Quest for a Content Quality Measure

Discussions started in 2019 by the World Federation of Advertisers (WFA) and Association of National Advertisers (ANA) and their visionary step of asserting influence over the design and execution of cross-media audience measurement, led back about a year ago to longstanding concerns about quantifying the quality of the advertising impression in different media types. For if cross-media audience measurement were to equate digital ad impressions with television ad impressions on a one-to-one basis, practitioners feared that this would exacerbate the already excessive weight given to cost per thousand and further reduce advertising ROI and brand equity lift.
Many television networks and seasoned buyside executives were especially concerned that if the wrong quality metrics were used, the power of television as an ad medium would be further obfuscated.
It is widely known but rarely talked about that any ROI attribution which only measures one media type will perforce have to credit all sales to that one media type. The ballooning growth of digital was largely driven by low CPMs and self-reported ROIs that did not reflect measuring more than one's own medium.
My company TRA was the first to measure cross-media ROI using big data and found that television has much higher ROI than digital, and specifically that television has much higher ROI than nonpremium digital video. The same findings have since been reported by many other companies including Simulmedia, BHC SMI sponsored by Fox and McKinsey, and Nielsen NCS. Note in the Nielsen NCS norms table below that linear television has almost double (specifically +86%) the ROI of nonpremium digital video ($3.80 vs. $2.04). Clearly, this is the truth standard for any quality content measure; unless the measure shows TV roughly +86% better than YouTube, that measure is not reflecting all of the television ad impact advantage. RMT Resonance has been shown to have lift effects in that range and higher (e.g., +95% ROAS in the Neustar study).
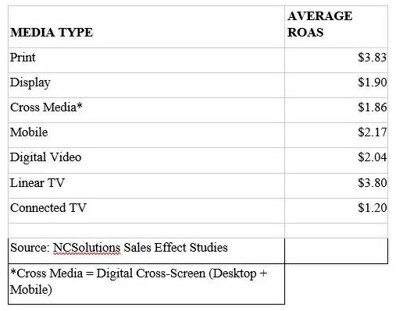
One might think then that ROAS norms like these could themselves be used as the Quality Content Measure the industry desires. However, that idea could be improved upon by using the ROI norms of one's own brand by media types. Yet even that idea could be faulted. For example, one could say that those norms reflected the creative the brand was using back then, and today's creative might lead to very different norms for the brand in terms of ROI by media type.
An idea which has been bruited a lot recently is the idea of using attention measures as the new industry standard for comparing the ad quality of alternative media type contexts. This idea seems at first glance to be quite promising: The idea of the Attention Economy, as coined by Karen Nelson-Field, is a hot idea everywhere today, and given how hard it is to establish new industry standards (ask the MRC, ARF, ANA, IAB, 4As, CIMM, et al) this attention groundswell could be ridden perhaps to a shortening of the way to hegemony.
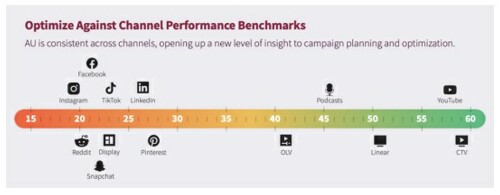
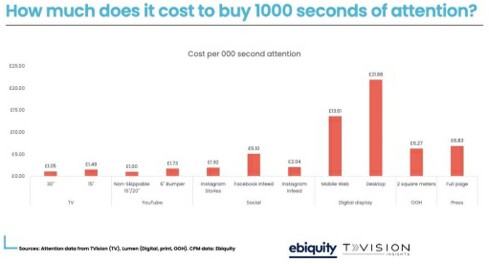
I thought it a good idea to check out how that would come out, and so I asked my friends at the attention measurement and prediction companies a simple question: How does linear TV compare with YouTube in attention? Here are the results from three suppliers who had compared the two types:
Adelaide:
Lumen:
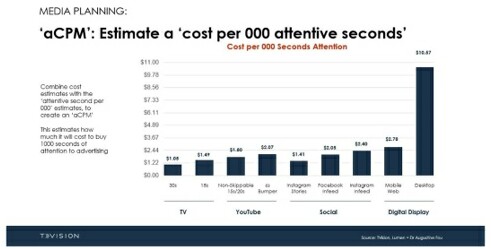
TVision:
Averaging across these three suppliers and controlling for media CPM differences, linear television comes up about +18% better than YouTube in the attention dimension, and further ahead when compared against other media types.
Attention + Persuasion = ROI?
Since the average ROI advantage for linear television is +86% over YouTube, but TV is only +18% better than YouTube in terms of attention, the rest of the +86% must be explained by the ARF Model dimensions above attention: communication, persuasion and sales themselves. In other words, in order to get the +86% higher ROI, in addition to TV's attention advantage there must also be other incremental TV advantage in the range of communication and/or persuasion and/or in the ability to actually cause behavior change.
Astute observers such as ARF research head Paul Donato have commented that much of television's work appears to be done at low attention levels, i.e., subconscious levels, what Daniel Kahneman calls System 1. This is supported by an old Gallup & Robinson study which reported that TV ads have about a quarter of their normal influence on people who are in the room but claim to not be viewing.
Fox executive vice president Audrey Steele comments that focusing solely on the eyes ignores the advertising value of the audio track. Jack Wakshlag has also done research which supports the power of the audio track to bring eyes back to the screen.
The ARF has also shown evidence that advertising does not work in such a way as to confer a linear relationship between duration of attention and advertising value, which the MRC has acknowledged as a relevant consideration. Yet the results of attention work are based on a mainspring of counting seconds of attention duration (except for Adelaide, which has also criticized excessive dependence on duration).
Duane Varan objects to placing too much focus on attention and argues that we ought to focus more on inattention. Part of his reasoning is supported by an elaborate experiment he did involving eight different types of neuro/biometric measures. This experiment showed that the eight different measures each measured a different aspect of attention and their results disagreed, implying that there may be eight types of attention worth measuring.
Karen Nelson-Field, the earliest settler in this new coming of age of attention as a major subject in advertising, points out the reason why television and premium OTT have more attentional power:
"The platform is the main driver of how much attention an ad can gain.
"This is because attention elasticity forms the baseline attention opportunity. Attention elasticity is the range of attention the platform has the capacity to deliver. It's the difference between the lowest and highest average number of attention seconds, and this is directly moderated by the functional performance of the platform. For example, scrollable formats suffer from a tight, inelastic attention while linear and OTT TV have fewer distracting features and, therefore, looser attention elasticity. When elasticity is tighter, attention is lower; when it is looser, attention is higher. When elasticity is looser (i.e., the range is bigger), good creative shines through, when elasticity is tighter (i.e., the range is smaller) even good creative has no chance. As such, the opportunity for creative to shine with more attention is greater on TV due to its attention elasticity."
These are deep insights, and all the companies contributing to the quest are indeed moving us forward. Television, to me, has the ROI impact advantage that is far greater than its attention advantage because of the depth of the connection television makes with the viewer, which is conducive to more complex and emotional brain encoding. Deep character development, universal themes, strong acting and directorship, production values, music, live sports, live news -- these important aspects of television cannot be reflected in simple surveys or camera surveillance robotics. The essence of the difference is real human feelings.
As one datapoint, the average television series has 60-80 DriverTags, the typical YouTube video fewer than 20 DriverTags. Each DriverTag is a way of linking into the conscious and subconscious processes of the viewer.
RMT Resonance could be the missing ingredient in the quest for the industry's most ROI-predictive pre-buy Quality Content Measure. Whether combined with attention or on its own, the resonance between an ad and its context in terms of the 265 empirically-distilled psychological predictor content codes (RMT DriverTags) has been shown to be predictive of sales effect by Nielsen NCS and predictive of branding lift by 605. RMT and NBCU found that DriverTags explain/predict 76% of the information in Nielsen ratings. The ARF Cognition Council found that RMT Motivations (rollups of the DriverTags) explain/predict 48% of the information in IRI sales data. Simmons and Neustar, in other separate studies, similarly show that RMT resonance does capture the richness of the context variable and its interaction with the creative and audience variables.
The quest is not over, nor is it just beginning. There are good options on the table and major players are doing the necessary work of advertising science to reach the right decisions. The end of the rainbow is in sight, and it will need to reflect not just attention but also emotion, cognition and subconscious motivation: The things that happen after attention and before sales in the ARF Model, in the zones of communication and persuasion, which have everything to do with motivation.
Click the social buttons to share this content with your friends and colleagues.
The opinions and points of view expressed in this content are exclusively the views of the author and/or subject(s) and do not necessarily represent the views of MediaVillage.com/MyersBizNet, Inc. management or associated writers.

Bill Harvey
Bill Harvey, who won an Emmy® Award in 2022 for his invention of set top box data, has spent over 35 years leading the way in media research with pioneer thinking in New Media, set top box data, optimizers, measurement standards, privacy standards, the A…