When to Use Fusion, When to Insist Upon Direct Match – Bill Harvey

Fusion Leaves Out 84% of Variation in Product/Brand Purchase
Today we have a vast sea of data sources to choose among in making better media decisions. This article is a simple explanation of the two main types of data available, how they differ from each other and when it is advisable to use each one of them.
Fusion is a type of information that is estimated from relationships in the data. Direct Match is a type of information that is completely based on fact. That makes it easier to explain Direct Match so let’s start there.
Say you have a million homes for which you have set-top box data and 115 million homes for which you have auto registration data. If you are privacy secure and therefore do not keep any Personally Identifiable Information (PII) in your own shop, you can make a deal with Experian or another company to be your matching partner. The source of your set-top box data can send that company, Experian let’s say, the names/addresses of the set-top box homes linked to the anonymous ID number of each home — withholding the actual viewing data from e.g. Experian. Your source of the auto registration data can do the same thing. Then Experian can tell you “The home that cable operator X calls ID26hjdgfa783gf5b298zh is the same home that the auto registration data compiler calls ID3854gf8qy3bnrodjn2.” This is Direct Match. You know for sure that you are getting TV viewing data for the same home from which you are getting purchase data.
Now let’s look at Fusion. There are actually quite a few versions of Fusion so we will describe a couple of the most-used forms.
Say you have a million homes in which you have set-top box data and you have auto registration data by zipcode. In one popular form of Fusion, you assume that a household has a better or worse chance of owning a specific type of car based on which zipcode the household is in. For example, if the zipcode is 10% above average in ownership of Volvos, you assume that every home in that zip has a 10% above average chance of owning a Volvo. Let’s call that Geo Fusion.
Start over. Now let’s assume you have set-top box data for a million homes and you have demographic data on each household. Let’s say you have another study that breaks out auto ownership by make and model in relation to their demographics. You first see how well you can line up the demographics you have in that external study with the demographics you have on your million households. Let’s say there are 13 demographic groups for which you can line up the two sources. If you have the respondent-level data for the external study, you can look home-by-home (or person-by-person if it is a person-based study) and create an equation to predict auto ownership by make/model based on these 13 demographics. The equation will always consist of a weight to place on each demographic plus one constant factor that always gets applied. You weight each demographic by its given weight, then add these together, and for that home or individual you have a probability that it is an owner of Honda Civic or whatever. You decide based on judgment how high a probability you will want before identifying that home or individual as an owner of a specific make/model. You can set this cutoff point so that the number of homes that have a make/model will generally be in the same ballpark with industry statistics on how many sales are made of that make/model every year.
Here’s the same case with different assumptions. Let’s say that you don’t have respondent level data for the external study, but you can run crosstabs of combinations of demographics such as homes with annual household income $100K+ that are also headed by a person 25-54. In a cell like that you can see what make/model they own. Then you break your million set-top box homes into the same combined demographic cells and look at what penetration a specific make/model has in that cell. You then give every home in that cell the same ownership profile as in the external study in that same combined demographic cell. If 1.2% of the homes in the $100K+/25-54 cell own a Volvo, you randomly assign 1.2% of your set-top box homes in that cell to owning a Volvo. Let’s call that Demographic Fusion or Demo Fusion for short.
Geo Fusion and Demo Fusion can also be combined in various ways.
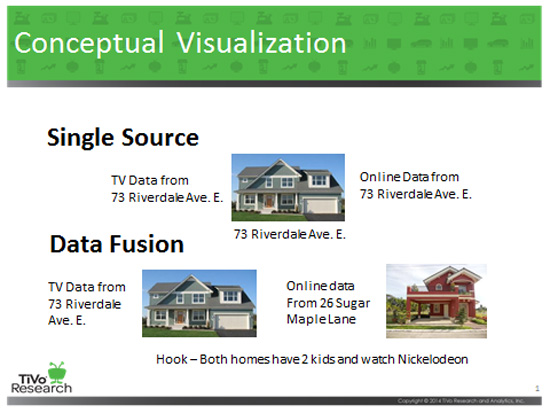
Then there is a form of Fusion where you select one home at a time and give it all of the characteristics of a home in a completely different sample. For example, you take everything you know about each of your million set-top box homes and compare that to everything you know about the homes or people in a completely separate sample where you have respondent level data. Let’s say it’s the Nielsen National Peoplemeter sample of 18,000 homes where car ownership is known by make. You want to fuse this onto your million set-top box homes so as to have a Fusion estimate of what makes are owned by the homes in your sample. You can build, buy or rent a computer program that will do this for you, looking at all the programs viewed based either on the Nielsen Peoplemeter in the one sample or based on the set-top box data in the other sample; plus you can line up as many demographics as you have in your set-top box sample that line up with the demographics in the Nielsen sample. Then the system will connect each home in your million home set-top box sample to one home in the Nielsen sample, and the auto make(s) owned by the Nielsen home will be assigned to your homes that are matched to the Nielsen home based on TV viewing and demographic similarities. Let’s call this 1:1 Fusion. Here is an illustration of how that works:
How accurate is Fusion? It is as accurate as the variables used perfectly predict the behavior you are trying to assign to the home. For example, if you are trying to assign each home in your sample whether or not they have a current home mortgage, you can probably make a pretty good prediction if you have real data on each household’s being a homeowner vs. a renter, plus income and age, because those three factors have a huge weight on whether the home has a mortgage. Almost no renters will have a mortgage (the few that do will have it on a vacation home or something like that).
Almost all human behavior is much more complex than the mortgage example. Let’s say you are trying to predict specific brand purchase based on Geo, Demo and TV program viewing. This implicitly assumes that the choice of brand in the category is based only on Geo, Demo and TV program viewing. However, as we all know, brand choices are based on a lot more factors, including the brand’s image vs. the person’s self-image and ideal self-image, the experience with the brand that the household members have had, the relative brand selection influence of the various household members, who went shopping for the home this week, price of the various brands in the store shopped, out-of-stock in that store, shelf facings and displays in that store and other in-store advertising, all other advertising for the brand and its competitors, what friends and relatives say about the brand, associations between the brand and fond or bad memories of various times in one’s life, and so on.
Over the years various research studies have been done to determine the degree to which demographics + geographics predict product and brand purchase. The range of the findings of those studies is between 10% and 20%. For example, a study of IRI panel data done in the 1990s by CBS consultant Dr. Henry Assael (who teaches at NYU’s Stern School of Business) found that the answer was 16%. This was the highest number I had ever seen for that parameter. In other words, if you use Demo + Geo Fusion, the likelihood is that you are making predictions based on only about a sixth of the weighted variables that you would need to make a nearly perfect prediction — which is why the subtitle above is that Fusion leaves out 84% of the variation in product/brand purchase.
Here is a case where TiVo Research/TRA had both the actual household-level auto registration data and also had the zip+4-level averages. In the 10 to 14 households in a typical zip+4, the data in the latter file were identical for every household within that zip+4. If only one of the say 10 households in that zip+4 owned a Volvo then each of the 10 households would show that it had a 10% chance of owning a Volvo. To analyze the latter data by the shows watched by Volvo owners, the computer would count everyone in that zip+4 as a 10% owner of a Volvo, and analyze the programs they viewed. That specific Fusion of data has been commercially offered and used for many years. Note however how different the results are between the actual and the Fusion below:
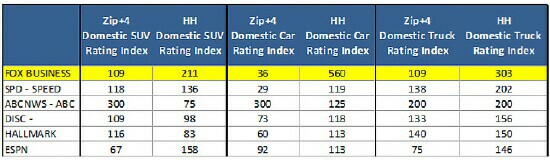
Whereas in reality Fox Business is a terrific environment for advertising domestic cars, the zip+4 Fusion shows it to be a terrible environment. When you look at all 6 random auto brands and all the programs here is what those trillions of calculations come down to:
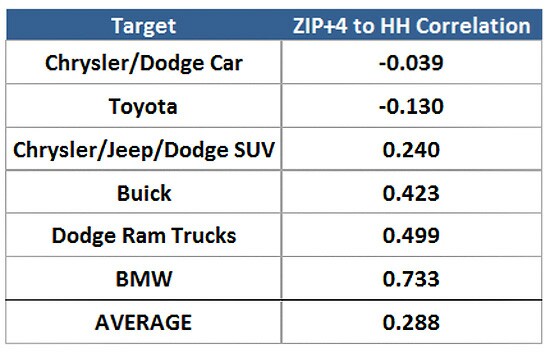
The result is a very low correlation between the Direct Match and the Fusion. We do not believe that Fusion is that bad in all cases. Again, some things are more predictable from demographics/geographics than other things. The selection of a car reflects the self-images of the buyers and their idealized future self-image dreams of themselves. That is the kind of psychological deep water that tends to float disconnected from simple demographic/actuarial tables.
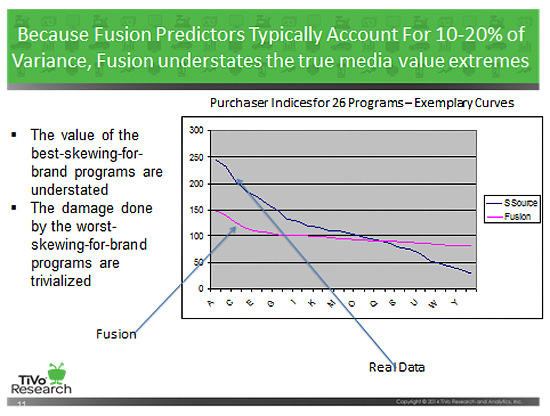
Let’s say you are implementing a Fusion that validates pretty well and looks plausible. Let’s assume you have lucked into one of the cases where the demo/geo/other predictors you have paint a pretty probable picture of the prospect. That’s good. However, there is one other aspect of Fusion to be aware of, even when it is as good as it gets. What also happens when you use Fusion typically is that the predictions flatten the differences. This has the fancy name of “Regression to the Mean,” which means that because you are leaving out most of what causes differences, differences become understated. If you array TV programs based on a Fusion prediction of brand purchase, for example, you will see many programs have indices in the 90-110 range and very few are above 130 or below 70. If you do the same analysis by Direct Match you will tend to see the opposite picture, with a great many programs with indices in the hundreds, for example.
So when is it safe to use Fusion? When Direct Match is unavailable, for example for privacy reasons. Then Fusion is better than nothing.
There can also be other reasons such as cost, time considerations, or if Direct Match would only be available on a sample that is not as large or representative as the sample for which you can do Fusion but not Direct Match.
It also depends on accountability. If the client is not going to give you a bonus for ROI increase or even compare your work to the ROI it produces, then whether or not you use Fusion would not seem to matter. Whereas if ROI is going to be how you are judged then the risk of using Fusion is too great and you need to do whatever it takes to use Direct Match. To our knowledge there have been no client-sanctified public cases of proven ROI lift produced by Fusion methodology. TiVo Research/TRA has published at least four separate cases (with client permission to name names through the ARF) where Direct Match has produced ROI lifts ranging from 10% to 233%.
TiVo Research/TRA itself uses Fusion in two kinds of cases. Both are driven by privacy considerations. TiVo and TRA both have the strongest commitments to protect people’s viewing records, so that even world-class experts cannot find out that specific adults watch cartoons, or whatever is their fancy. Therefore viewing records at the household level cannot be exported to clients. If they were, a client could from the data they have on the same household easily determine the household’s identity and then that household’s viewing records would be penetrated. In such cases, TiVo Research/TRA can export tables containing a minimum of 30 households per table. Fusion experts can use the columns and rows to dissect the data at a very fine-grain level without ever being able to penetrate any person’s viewing records. And yet the combination of small geo and detailed demographic data obtained in this way, when applied by Fusion, should have a high degree of accuracy relative to other Fusion methods.
In the other case, digital targeting, TiVo Research/TRA cannot let a cookie be coded by the specific household’s actual viewing (say for tune-in advertising purposes) without creating the possibility of someone re-identifying the household and then knowing that they view “Elementary,” for example.
Despite the fact that the average person might see little harm in anyone knowing what he or she watches on TV, TiVo and TRA do not believe that anyone has the right to reveal such information except by prior written permission from the individual. Nor do they seek such permission. A lot of advertising value is still being created from naturally occurring data by TiVo Research/TRA operating within the highest privacy walls.
In the cookie case, TiVo Research/TRA uses Fusion based on 249 demographic (a few of those are geographic) attributes such as Male 18-20, Hispanic/Mexican, Computer Professional, etc. to link predicted behaviors onto cookies. On average the lift in ratings caused by digital campaigns targeted in this way is about 10%. So there is some proof of performance for the Fusion. Undoubtedly Direct Match would cause more rating lift, but morally it is not an option.
For more information on this subject I recommend readingLinking TV Exposure to Purchasing Behavior: Achieving the Gold Standard of Accountability and Better Television Audience Measurement Through the Research Integration of Set-Top Box Data.
Bill Harvey is a well-known media researcher and inventor who co-founded TRA, Inc. and is its Strategic Advisor. His nonprofit Human Effectiveness Institute runs his weekly blog on consciousness optimization. Bill can be contacted at bill@billharveyconsulting.com
Read all Bill’s MediaBizBloggers commentaries at In Terms of ROI.
Check us out on Facebook at MediaBizBloggers.com
Follow our Twitter updates at @MediaBizBlogger
The opinions and points of view expressed in this commentary are exclusively the views of the author and do not necessarily represent the views of MediaBizBloggers.com management or associated bloggers. MediaBizBloggers is an open thought leadership platform and readers may share their comments and opinions in response to all commentaries.

Bill Harvey
Bill Harvey, who won an Emmy® Award in 2022 for his invention of set top box data, has spent over 35 years leading the way in media research with pioneer thinking in New Media, set top box data, optimizers, measurement standards, privacy standards, the A…