Checking the New Nielsen Currency Against Two Other Sets of Evidence

I’ve just compared raw big data, passive portable peoplemeters, and the new Nielsen currency based on panel plus big data. All three sources of data show exactly the same trend lines over time. There is no denying that the linear television audience is declining at the rate shown in currency. Even better: when streaming is included, the decline in total use of television sets is minimal. And even that minimal decline is counterbalanced by the increase in watching television on other devices. In other words, the television audience is as strong as it ever was before. All of the shakeup is musical chairs during an inevitable historic shift to all-digital delivery through wires, cables, and the air.
Here are the results of my latest analysis comparing the PPM (the passive peoplemeter I helped invent for Arbitron, which is now owned by Nielsen and being made into wearables, as I had set out in the original plans).
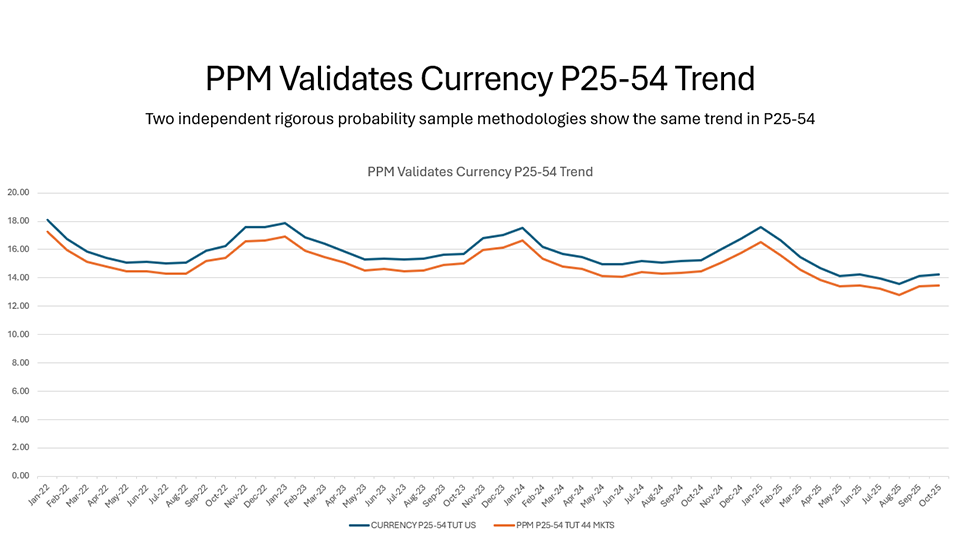
The PPM is a personal device which captures audio watermarks. Its distribution by Nielsen is in 44 DMAs. The total use of television sets for both linear and streaming is captured both by the PPM (orange line above) and by the fully national Nielsen panel + Big Data currency (blue line above). As you can see, since the beginning of 2022, there has been a very small downturn.
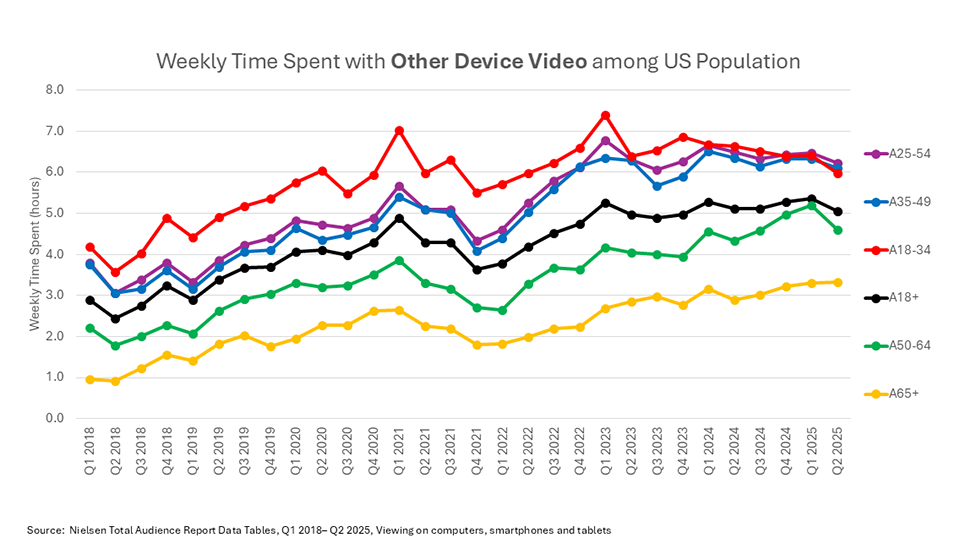
Below is a chart I showed you in my October 22, 2025 column. What it shows is that the use of television on computers, smartphones, tablets, video gaming consoles, and DVD players has been increasing since 2018. This is where the audience seemingly lost in the prior chart has gone – not off of television entirely, but to watching it on other devices besides the TV set.
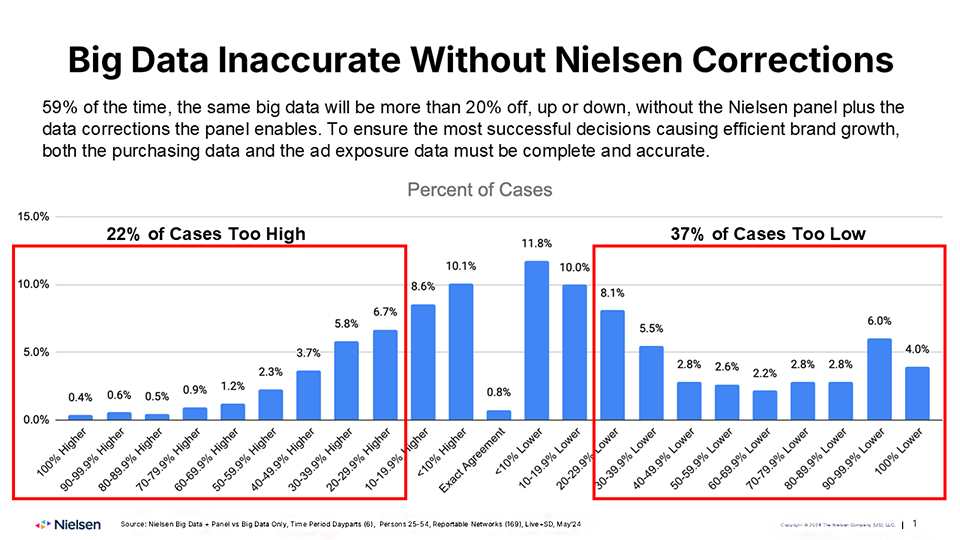
The comparison between Nielsen panel + big data currency and raw big data, reported in my October 1, 2025 article,shows the same close agreement in trendline. “Raw” big data means before Nielsen made any adjustments. As you may know, Nielsen makes numerous adjustments to raw big data, due to such common big data phenomena as the absence of virtually all streaming data, networks and stations not monitored by smart TVs, geo and demographic biases, etc.1
These are very significant changes, as can be seen from the following chart, which shows that without these adjustments, the program-level audience data would be off by more than 20% 59% of the time.
However, when comparing trend lines in terms of the most basic measure (how much time spent with television is changing over time), I felt that the raw big data was a better instrument to use. I didn’t want to make it any easier for the two technologies to agree by adjusting one with the other before making the comparison.
Nielsen has agreed to make it a regular practice to do these out-of-sample comparisons with raw big data and with PPM, so as to provide the industry with “a second opinion”, kind of a “checks and balances” approach inspired by the Founders of the USA.
Putting all this into historical perspective, how the industry has changed since I first got into the business. I recall years back when Dave Poltrack said to me, “I don’t mind using questionnaire-based data to measure total TV audiences outside of sales transactions, because it’s so easy to measure the rankings of shows, any method you use will work well enough.” When he said that the average rating of all primetime series, leaving aside sports and Specials, was 18.0, and today it’s under 1.0. It’s no longer an easy-to-measure medium. And it becomes more difficult every day as the introduction of new technologies continues to accelerate. The same is true of digital and pretty much any medium you can think of.
When I first introduced set-top box data as a research method in the 90s, and linked that with deterministic purchase data 2005-2014 at TRA (and with digital ad exposure data), I never presented that as an alternative to Nielsen, but as a supplementary service with the potential for gradual incorporation in Nielsen. That was a long time ago, but that dream is now coming true. Nielsen has incorporated all my old ideas, and even some of my new ones2, and the game goes on and will never stop, because Nielsen will always be reaching for perfection, and the challenge slope will never stop inclining.
1The one tweak Nielsen made to make the data usable was the On/Off algorithm, because without that, the raw big data would have been unusable. A full explanation of this is found in my October 1, 2025 article.
2Nielsen is one of my consulting clients.
Posted at MediaVillage through the Thought Leadership self-publishing platform.
Click the social buttons to share this story with colleagues and friends.
The opinions expressed here are the author's views and do not necessarily represent the views of MediaVillage.org/MyersBizNet.

Bill Harvey
Bill Harvey, who won an Emmy® Award in 2022 for his invention of set top box data, has spent over 35 years leading the way in media research with pioneer thinking in New Media, set top box data, optimizers, measurement standards, privacy standards, the A…