Marketing mix models have been reporting on media's contribution to sales and other business metrics for decades. In that time, MMM has survived the rise of digital, the fragmentation of audiences, the growth (and decline) of multi-touch attribution, and the loss of cookies and mobile identifiers.
Today, with renewed interest from brands, many of which never left it behind, and with new data-handling capabilities making MMMs faster and more flexible, marketing mix modeling is flourishing. At the same time, the industry is coalescing around new prescriptions and frameworks for what “modern MMM” should look like.
In December 2025, the IAB Measurement, Addressability & Data Center published Modernizing MMM: Best Practices for Marketers, identifying six ingredients that characterize a modern MMM: stronger foundations, omnichannel coverage, speed and flexibility, integrated measurement, actionable outputs, and organizational adoption.
Other industry participants have pointed to similar related needs. In 2023 Marketing Science Institute’s (MSI) Blue Ribbon Panel Report: Charting the Future of Marketing Mix Modeling (MMM) Best Practices named data granularity as the most pressing needed MMM improvement. A 2025 Kantar/Meta global study of 1,935 measurement professionals at large advertisers found that 34% prioritize MMM above all other measurement solutions, yet 37% identified greater granularity and actionability as the leading opportunities to improve it. And just this spring, eMarketer called for MMM providers to deliver more actionable findings.
Some of MMM’s core components haven’t changed much over the years. Bayesian priors, saturation curves, and adstock analyses exist for most MMMs. But in response to the industry’s call for modernization, and to new competition from Google and other market entrants, traditional MMM is evolving. New data elements can now be incorporated into modernized marketing mix models, allowing them to surface granular and actionable findings that models in past years could not.
Adelaide built its AU metric for exactly this kind of use case. AU is a 0–100 media quality score that predicts the probability an ad placement will capture attention and contribute to a business outcome. It is trained and validated against outcomes data, and advertisers have long used it to connect media quality to business performance. In the “Integrated Measurement” section of its MMM Best Practices, the IAB explicitly names attention as a metric that should be mapped to business outcomes consistently as an operational feature, not as an ad-hoc indicator. That is a role AU has already played for years. Bringing AU into MMM extends its value beyond the individual campaign into broader brand and business analytics.
Where AU Fits In A Brand’s MMM
AU can play three useful roles in MMM: predictor, multiplier, and confirmer. Each role serves a different purpose.
- As a predictor, AU can be analyzed against historical outcome data before being introduced as an ingredient into a marketing mix model. This analysis validates AU’s ability to predict a brand’s KPIs and helps identify what levels of media quality business performance requires.
- As a multiplier, AU can be loaded as an impression weight inside a mix model. Each impression is scaled by its AU score before the media data is loaded into the MMM. The mix model’s data structure does not need to change, but the model inputs become much more specific. Instead of treating every impression within a channel as equivalent, the mix model can distinguish between impressions with different levels of media quality. Weighted inputs are already compatible with Recast, Google’s Meridian, and every major commercial MMM platform.
- As a confirmer, AU can be analyzed alongsidea mix model’s outputs to validate whether the model’s recommendations point toward media that AU media-quality measurement also predicts will perform.
The multiplier role is where AU has the most direct effect on an MMM. AU delivers two distinct benefits: improved model fit and increased model output granularity.
Improving Model Fit
In traditional MMM, channel impressions are loaded into models as undifferentiated chunks. A TV impression is a TV impression. A display impression is a display impression.
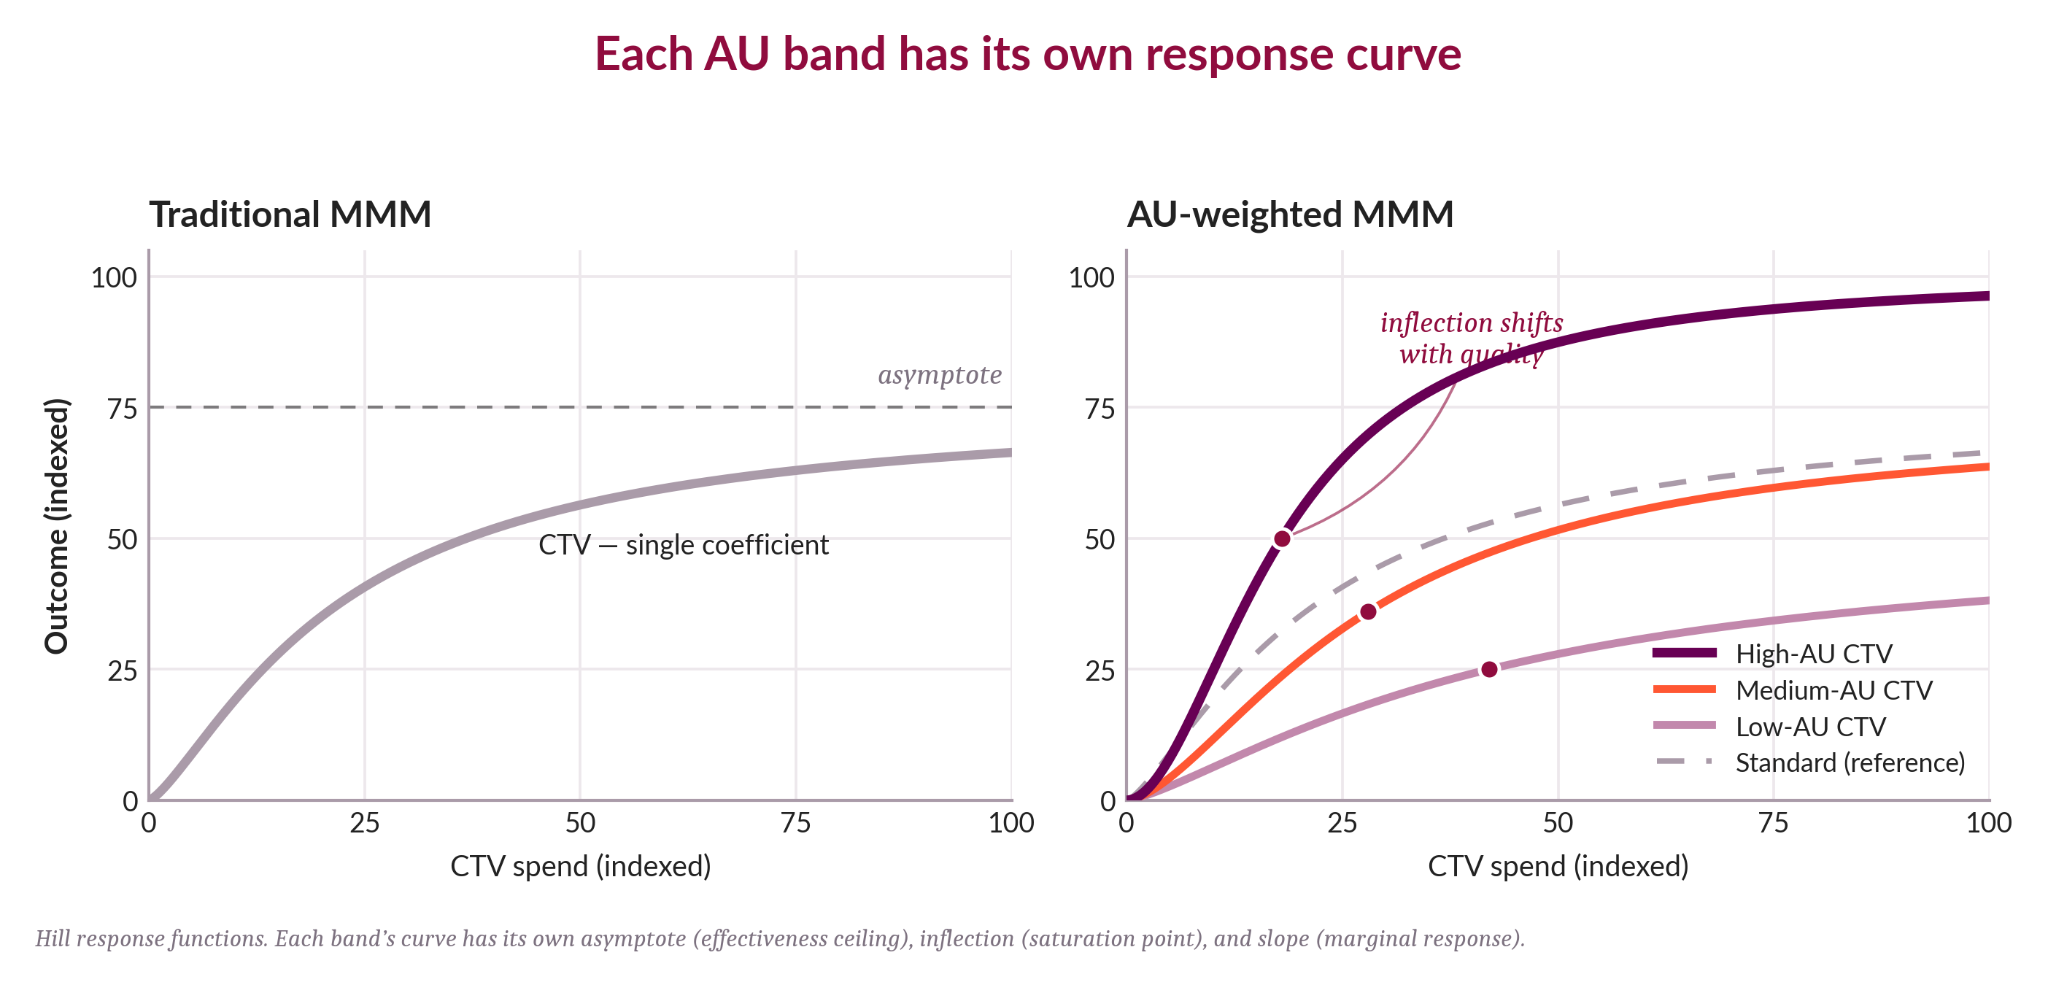
But media does not work that way in practice. A TV impression during a major sports tentpole event may affect outcomes differently than a TV impression during a forgettable mid-tier reality show. A high-quality CTV impression may not carry the same value as a low-quality one, even if MMMs count them the same.
When mix models have no direct way to account for that variance, its effect is concealed. It may show up as noise in the residuals, overstated channel coefficients, or digital channels that appear to deliver implausibly high returns because they generate enormous impression volumes.
Weighting impressions by AU gives MMM a media quality signal to work with. It allows mix models to account for the difference between impressions that are merely delivered and impressions that are more likely to capture attention and contribute to outcomes.
Adelaide's published case study with MMM provider Arima and a global CPG brand illustrates this point. In this example, the brand's spend-based MMM attributed 21% of sales to media. An unweighted impressions-based MMM analysis attributed 76% of sales to media, nearly four times the benchmark, and an implausible overstatement. When impressions were weighted by AU, the new model re-stated media’s contribution to sales at 35%—much closer to the spend benchmark—while also improving model fit.
Arima founder Winston Li described the result as “an impressions-based view of media performance we could trust—one that aligns with spend and opens up entirely new possibilities for our clients.”
 Source: Adelaide Metrics (illustrative)
This granularity also makes the outputs more actionable. If a mix model can distinguish between high- and low-AU inventory, it can also support AU floors: minimum quality thresholds that represent the level of AU required to drive a specific KPI. The MMM can then recommend not just where to spend, but how much to spend against media with different levels of quality.
For a global beverage brand, KPI-specific AU floors ranged from 26 to 33 AU, with media above the 26 AU threshold delivering up to 2x stronger brand impact. Following this logic, a 20% lift above an AU floor is worth roughly a 10% higher CPM, a number the AU-weighted MMM can use in scenario-planning and forecasting exercises.
How To Bring AU Into Your MMM
AU is an MMM input, not an output.
There are six steps to incorporating AU into an MMM. The first three determine whether and how AU becomes a model input. The last three establish how to interpret and operationalize the MMM outputs once AU is included.
1. Establish the AU-outcome relationship. Analyze AU scores from a fresh audit, ongoing scoring, or Adelaide channel norms against historical KPIs. Identify the AU level where KPI performance begins to inflect. This is the predictor role: proving that AU and outcomes align before any model adjustments begin.
2. Define your AU score groups. Bundle scored impressions by AU level, typically high, medium/average, and low (though the right groupings may vary based on a brand’s needs), as well as placement, channel, or daypart—whichever data cut maps to the buying decisions your team needs to make.
3. Load AU as an impression weight. Scale each impression's raw count by its AU score before the spend, impression, and outcome data are loaded into the MMM. The data model structure does not need to change.
4. Run the MMM both ways and compare. Build the AU-weighted version alongside the unweighted baseline. Examine adjusted R², coefficient stability, posterior shrinkage, and whether the band-level coefficients rank-order with AU. They should, even though nothing in the modeling is forcing them to.
5. Translate the model outputs into action. Use the band-level coefficients and saturation curves to set AU thresholds, Quality-Adjusted CPM benchmarks, and placement-level spend recommendations. Adelaide’s Flight Control and Scale/Lift/Threshold tools help translate MMM outputs into format- and placement-level buying decision aids.
6. Validate alongside the model and iterate. As campaigns run, compare AU measurement of the purchased media against the MMM’s predicted outcomes. This is the confirmer role. Where the two diverge, the divergence is itself a finding, which can lead to more insightful evaluations in the next analysis cycle.
Connecting The MMM To Action
The IAB's fifth capability, “Actionable Outputs,” is what MMM users are most explicitly asking for.
A traditional MMM produces channel-level recommendations: spend more on CTV, less on display. An AU-weighted MMM produces more specific, placement-level recommendations: spend more on top-quartile-AU CTV, less on bottom-quartile-AU display. That level of specificity maps more directly to how advertisers buy media today.
This is where AU-weighted MMM starts to move from analysis to clear buying guidance. One QSR brand’s MMM provider—after running an AU-weighted analysis—used it to “inform placement decisions”and “test future dollars leveraging AU results.”
Quality-Adjusted CPM and AU thresholds become buying language that the MMM can quantify in dollars.
What AU-Weighted MMM Can Reveal Next
Improved model fit is AU’s starting point with MMM. Coming next is learning what AU-weighted MMM can show about temporal and pricing dynamics—adstock decay rates, incrementality patterns, and quality-related cost data.
Early evidence suggests high-AU impressions may decay more slowly (longer adstock) and resist saturation longer than low-AU impressions.
Does the same logic extend to incrementality? Does the marketplace price quality efficiently, or is there persistent dispersion that an AU-weighted MMM can surface? Can attention measurement tell us something about how media effects compound over a campaign? These are the questions Adelaide is working on answering now.
The future of MMM that the IAB, MSI, and others are pointing toward is built on better, more granular data inputs that can be translated into actions a media buying team can take. Quality-weighted impressions are among the most consequential of those inputs. Adelaide’s AU is here today and available to be put to work on behalf of brands, buyers, and mix modelers.
References: Kantar and Meta, “Understanding Marketing Mix Modeling (MMM) Adoption Dynamics in the Industry” (May 2025); IAB Measurement, Addressability & Data Center, “Modernizing MMM: Best Practices for Marketers” (December 2025); Marketing Science Institute, “MSI Blue Ribbon Panel Report” (July 2023); Adelaide × Arima case study with a global CPG brand; Adelaide engagements with a global beverage brand and a global media brand.
Posted at MediaVillage through the Thought Leadership self-publishing platform.
Click the social buttons to share this story with colleagues and friends.
The opinions expressed here are the author's views and do not necessarily represent the views of