In April 2023, I reported a Nielsen ONE finding that linear TV alone can reach 60% of American adults 25-54, an achievement that other media types measured by Nielsen ONE could, on average, not do on their own. CTV campaigns on average could reach 16%, mobile 31%, and computer 8%.
A month earlier, I had reported that the right combination of all four types can reach over 90%, and the campaign which achieved that at least cost in GRPs was 79.7% linear.
These analyses involved taking random samples of what were then ∼41,500 cross-platform campaigns, and the database is now roughly double that, enabling all sorts of additional analyses, including the one presented next.
The background before we get into the analysis is that Nielsen has come up with a very interesting concept of how cross-platform campaigns can be sliced and diced that I had never seen before. It’s based on making a Venn diagram of all of the inter-combinations of the four device types (linear TV, CTV, mobile, computer). One way Nielsen displays this in the Nielsen ONE Ads UI (user interface) looks like this:
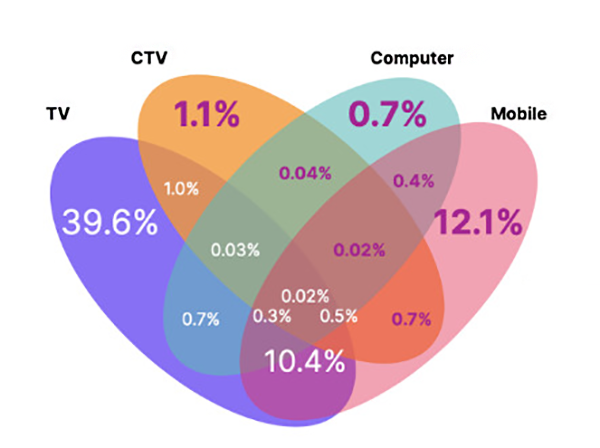
This is obviously not using proportionate space to represent the size of each group, but it is easy to see.
Another way that the same kind of data can be represented (for a different campaign this time) does spatially reflect the relative size of each group:
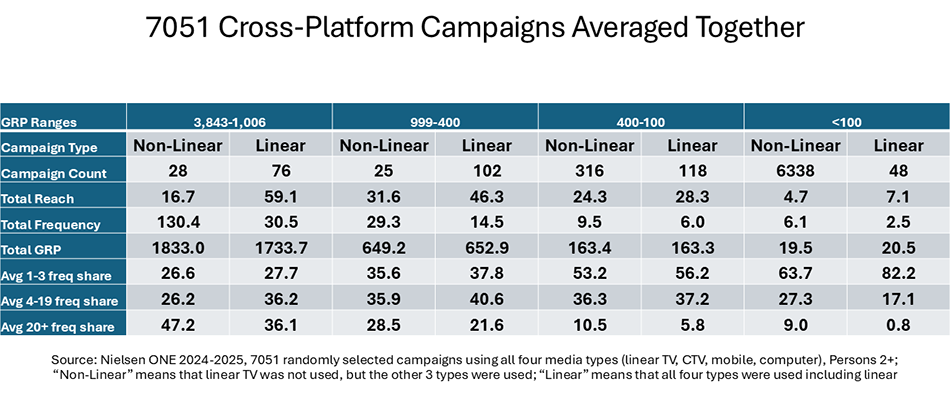
For example, in the campaigns which averaged around 1800 GRPs, the campaigns with linear had an average reach of 59.1%, versus an average reach of 16.7% for the campaigns without linear. That’s a +254% higher reach for the campaigns with linear in them.
For that same high GRP category, the average frequency for the campaigns with linear was 30.5, which would be about one a day in a one-month flight. The campaigns in that GRP category without linear averaged a 130.4 frequency, i.e., more than four exposures per person per day if the campaign was a one-month flight. One would hope that the 28 non-linear campaigns in that GRP category each had a lot of different creative executions. Seeing the same ad 130 times in a month could turn some people off.
Insufficient frequency appears to be more of a problem than excessive frequency: averaged across all campaigns, 20% of the campaign reach delivered excessive frequency, while 47.9% of campaign reach delivered insufficient frequency. However, this is only a rough gauge of what might be “excessive” since the lengths of the campaigns varied. But no matter how short or long the campaigns ran, the insufficient frequency remarks stand: 1-3 opportunities to see, as Ed Papazian might point out, might only result in one conscious exposure. WFA/ANA have been focused on the high end of the frequency issue, but now should also be looking at both ends.
The conclusion we draw from this analysis is that the brands that are thinking “digital first” and “CTV is all the TV I need” are making some big mistakes.
Posted at MediaVillage through the Thought Leadership self-publishing platform.
Click the social buttons to share this story with colleagues and friends.
The opinions expressed here are the author's views and do not necessarily represent the views of