Nielsen Data Show That Television is Not Declining
Some brands have told me that they are now only using TV for new product launches. Many more have positioned themselves as Digital First. And the ad revenues for television are declining even when streaming revenues are included. All of this reflects a perception that television is not as important as it once was to marketers and to audiences. However, the data do not back that up.
As reported here, it is very difficult to reach your total market without linear. As reported here, brand growth has collapsed since the great over-shift to digital started. In this article, we will take a look at television audiences and will see that they are not declining, merely changing how they watch. All of this decline is happening in people’s heads.
Digital has certainly told a better story and has out-marketed television, but in terms of value, especially with the way TV CPMs have decreased, television is a steal which buyers and brands could be benefitting from. I predict the smartest, most sophisticated brands will begin a shift back of dollars from digital into television, and will see their growth rates go back up.
For some reason, people have been looking at linear audience trends and have announced that the sky is falling. They don’t have to leave out streaming; Nielsen measures streaming with its streaming meter and integrations with about 20 major platforms, such as Amazon, and with more platforms integrating with Nielsen all the time.
Big Data (BD) leave out almost all streaming for both technology and contractual reasons, and Nielsen uses its panel to correct for missing data, such as that, and other types of errors which creep into BD. (Having invented set-top box data to research grade, I am allowed to be constructively critical of it.)
Let’s begin with a look at the linear part of the television audience, which the doomsayers have been focusing on. In the following graph, we can see that four different methods Nielsen is able to report agree pretty closely with one another.
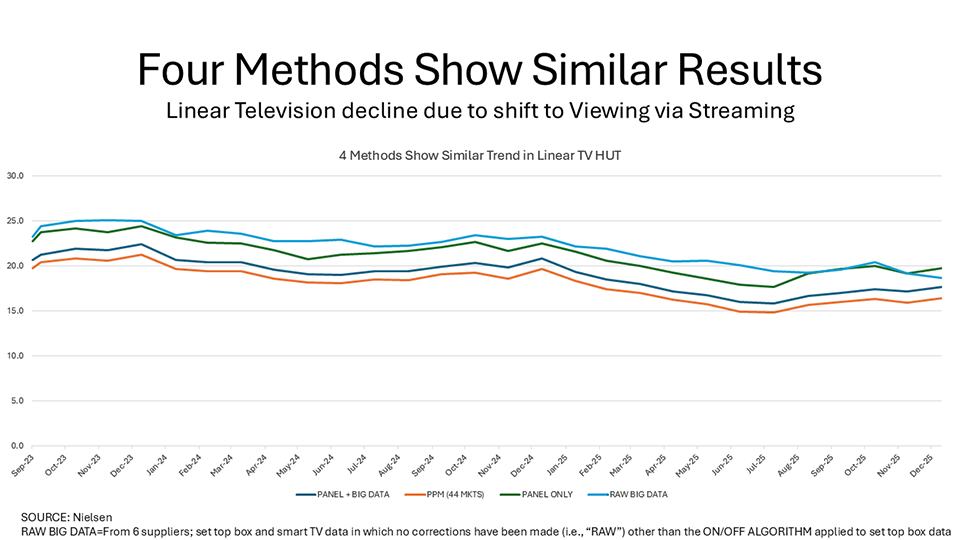
These four methods include currency (the dark blue line, now based on panel + BD), the PPM (orange line) which is in 44 markets (the rest of these methods are national) and is the passive portable peoplemeter (gradually moving into wearables as I originally intended) which picks up watermarks of programs and ads in video, audio, digital out of home, in-auto, and cinema media. Also the green line which is panel only, and the light blue line which is raw BD, meaning it is the BD the way it comes into Nielsen before Nielsen makes its corrections – except the Nielsen On/Off Algorithm is applied to the raw BD because otherwise you would see it flying so far above the other lines the chart would need to be re-scaled.
There is no argument about the downward direction, although it is not plummeting. This is the picture that has led to the drumbeat of television’s demise as depicted by so many commentators and now drummed thoroughly into everyone’s head.
Now let’s look at the picture counting streaming, measuring the total television audience on TV sets (Nielsen ONE also measures the television audience on computers, tablets and mobile devices but that is left out of the following graph because different ads are generally inserted, and those audiences are today considered premium digital not television; maybe someday that will change).
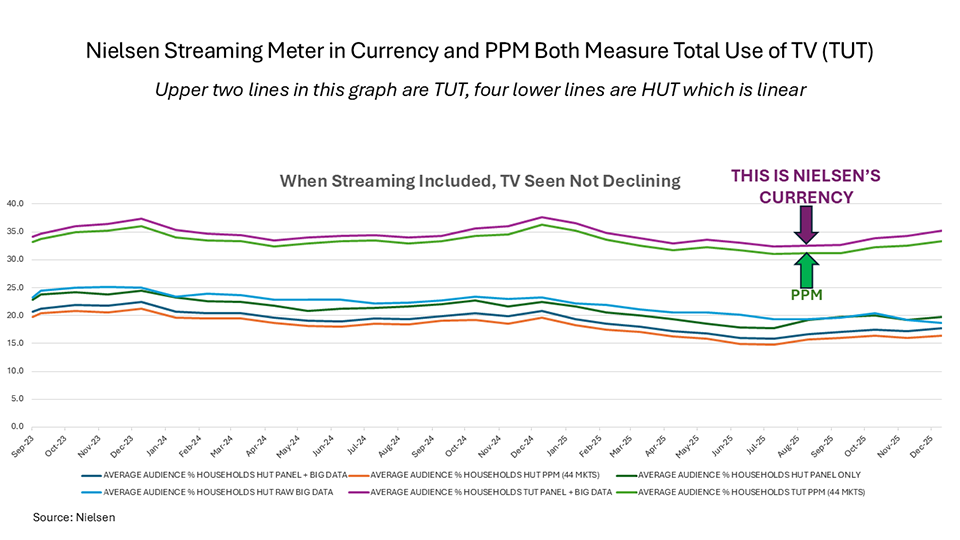
As you can see, the purple line of currency (panel + BD) is showing only a tiny difference between this past summer and the previous summer. In this article, I account for that as viewing on non-TV set devices. Here’s a chart from that article.
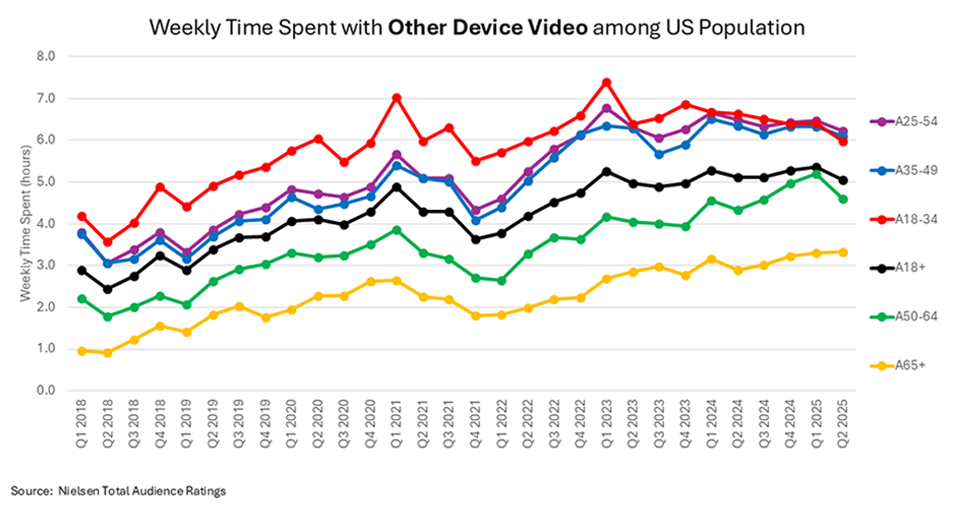
None of the viewing in the last chart above is included the previous charts. You can see that with the growth of viewing on non-TV set devices, the overall viewing of television is quite healthy!
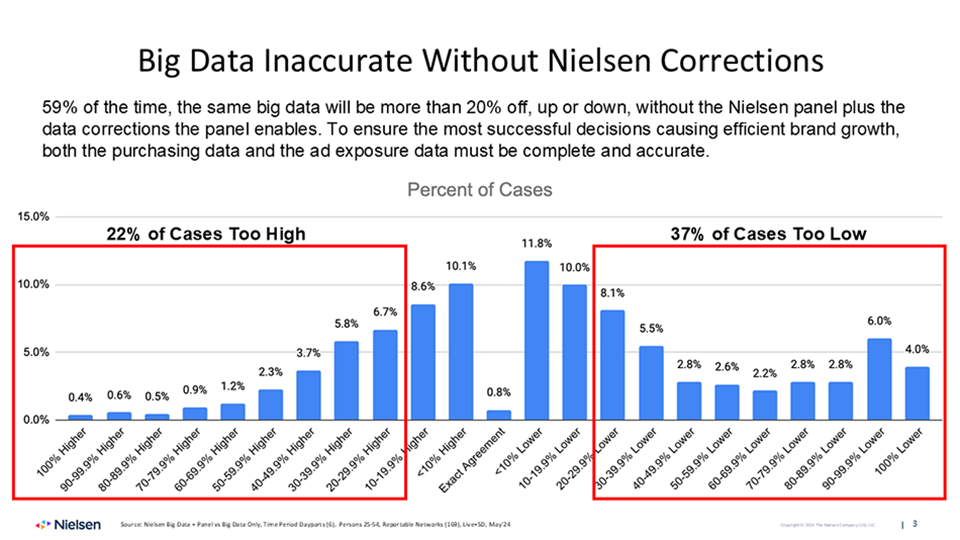
In the footnote of the first graph above and in the text, I’ve referred to Nielsen corrections made to BD. These are pretty important. BD pretty much leaves out streaming. Smart TVs give great data, but typically for only one set in the household, and for less than a quarter of all program content (but which represents about three quarters of all viewing minutes). There are other types of errors, and Nielsen has correction formulae for all of them. This next chart shows how far off the raw BD would be without those corrections. 59% of the time, the data would be off more than 20%.
The new methods including AI, attention, emotion, motivational resonance (“my” company RMT), are going to make all the media more effective, leading to an era of strong economic growth in which television (eventually all delivered over the Internet) regains the central position alongside RMNs and the best Creators.
Our new podcast explores the topic of Being in the In-between Phase, a liminal stage of growth when we can feel disoriented, lonely, or frustrated, and why it’s also a powerful indicator that real growth is happening. Rather than rushing to “fix” the discomfort, this episode invites listeners to slow down, listen more deeply to themselves, and learn how to navigate uncertainty with trust, patience, and self-awareness.
This month’s podcast length is ≈46 minutes. Watch the Video
Posted at MediaVillage through the Thought Leadership self-publishing platform.
Click the social buttons to share this story with colleagues and friends.
The opinions expressed here are the author's views and do not necessarily represent the views of MediaVillage.org/MyersBizNet.

Bill Harvey
Bill Harvey, who won an Emmy® Award in 2022 for his invention of set top box data, has spent over 35 years leading the way in media research with pioneer thinking in New Media, set top box data, optimizers, measurement standards, privacy standards, the A…