Nielsen Teaches TCA About OTT, OOH, VOD and More
Beverly Hills, CA -- It’s always interesting when executives from Nielsen come to TCA to make presentations and take questions from reporters and critics who spend most of their time focusing on programming and performers. Few TCA members devote very much time to reporting on research and data, but dozens of them turn out seeking to understand why the networks cancel certain shows while renewing others. There are still terrible shows that arrive D.O.A. and are mercifully cancelled before they do any lasting damage, but they are now the exception rather than the rule. Today, with Live+3, Live+7, Live+35 and even longer periods of audience measurement even mediocre series have the luxury of time on their hands as viewers discover them at various times during their first season or two and across a multitude of platforms.
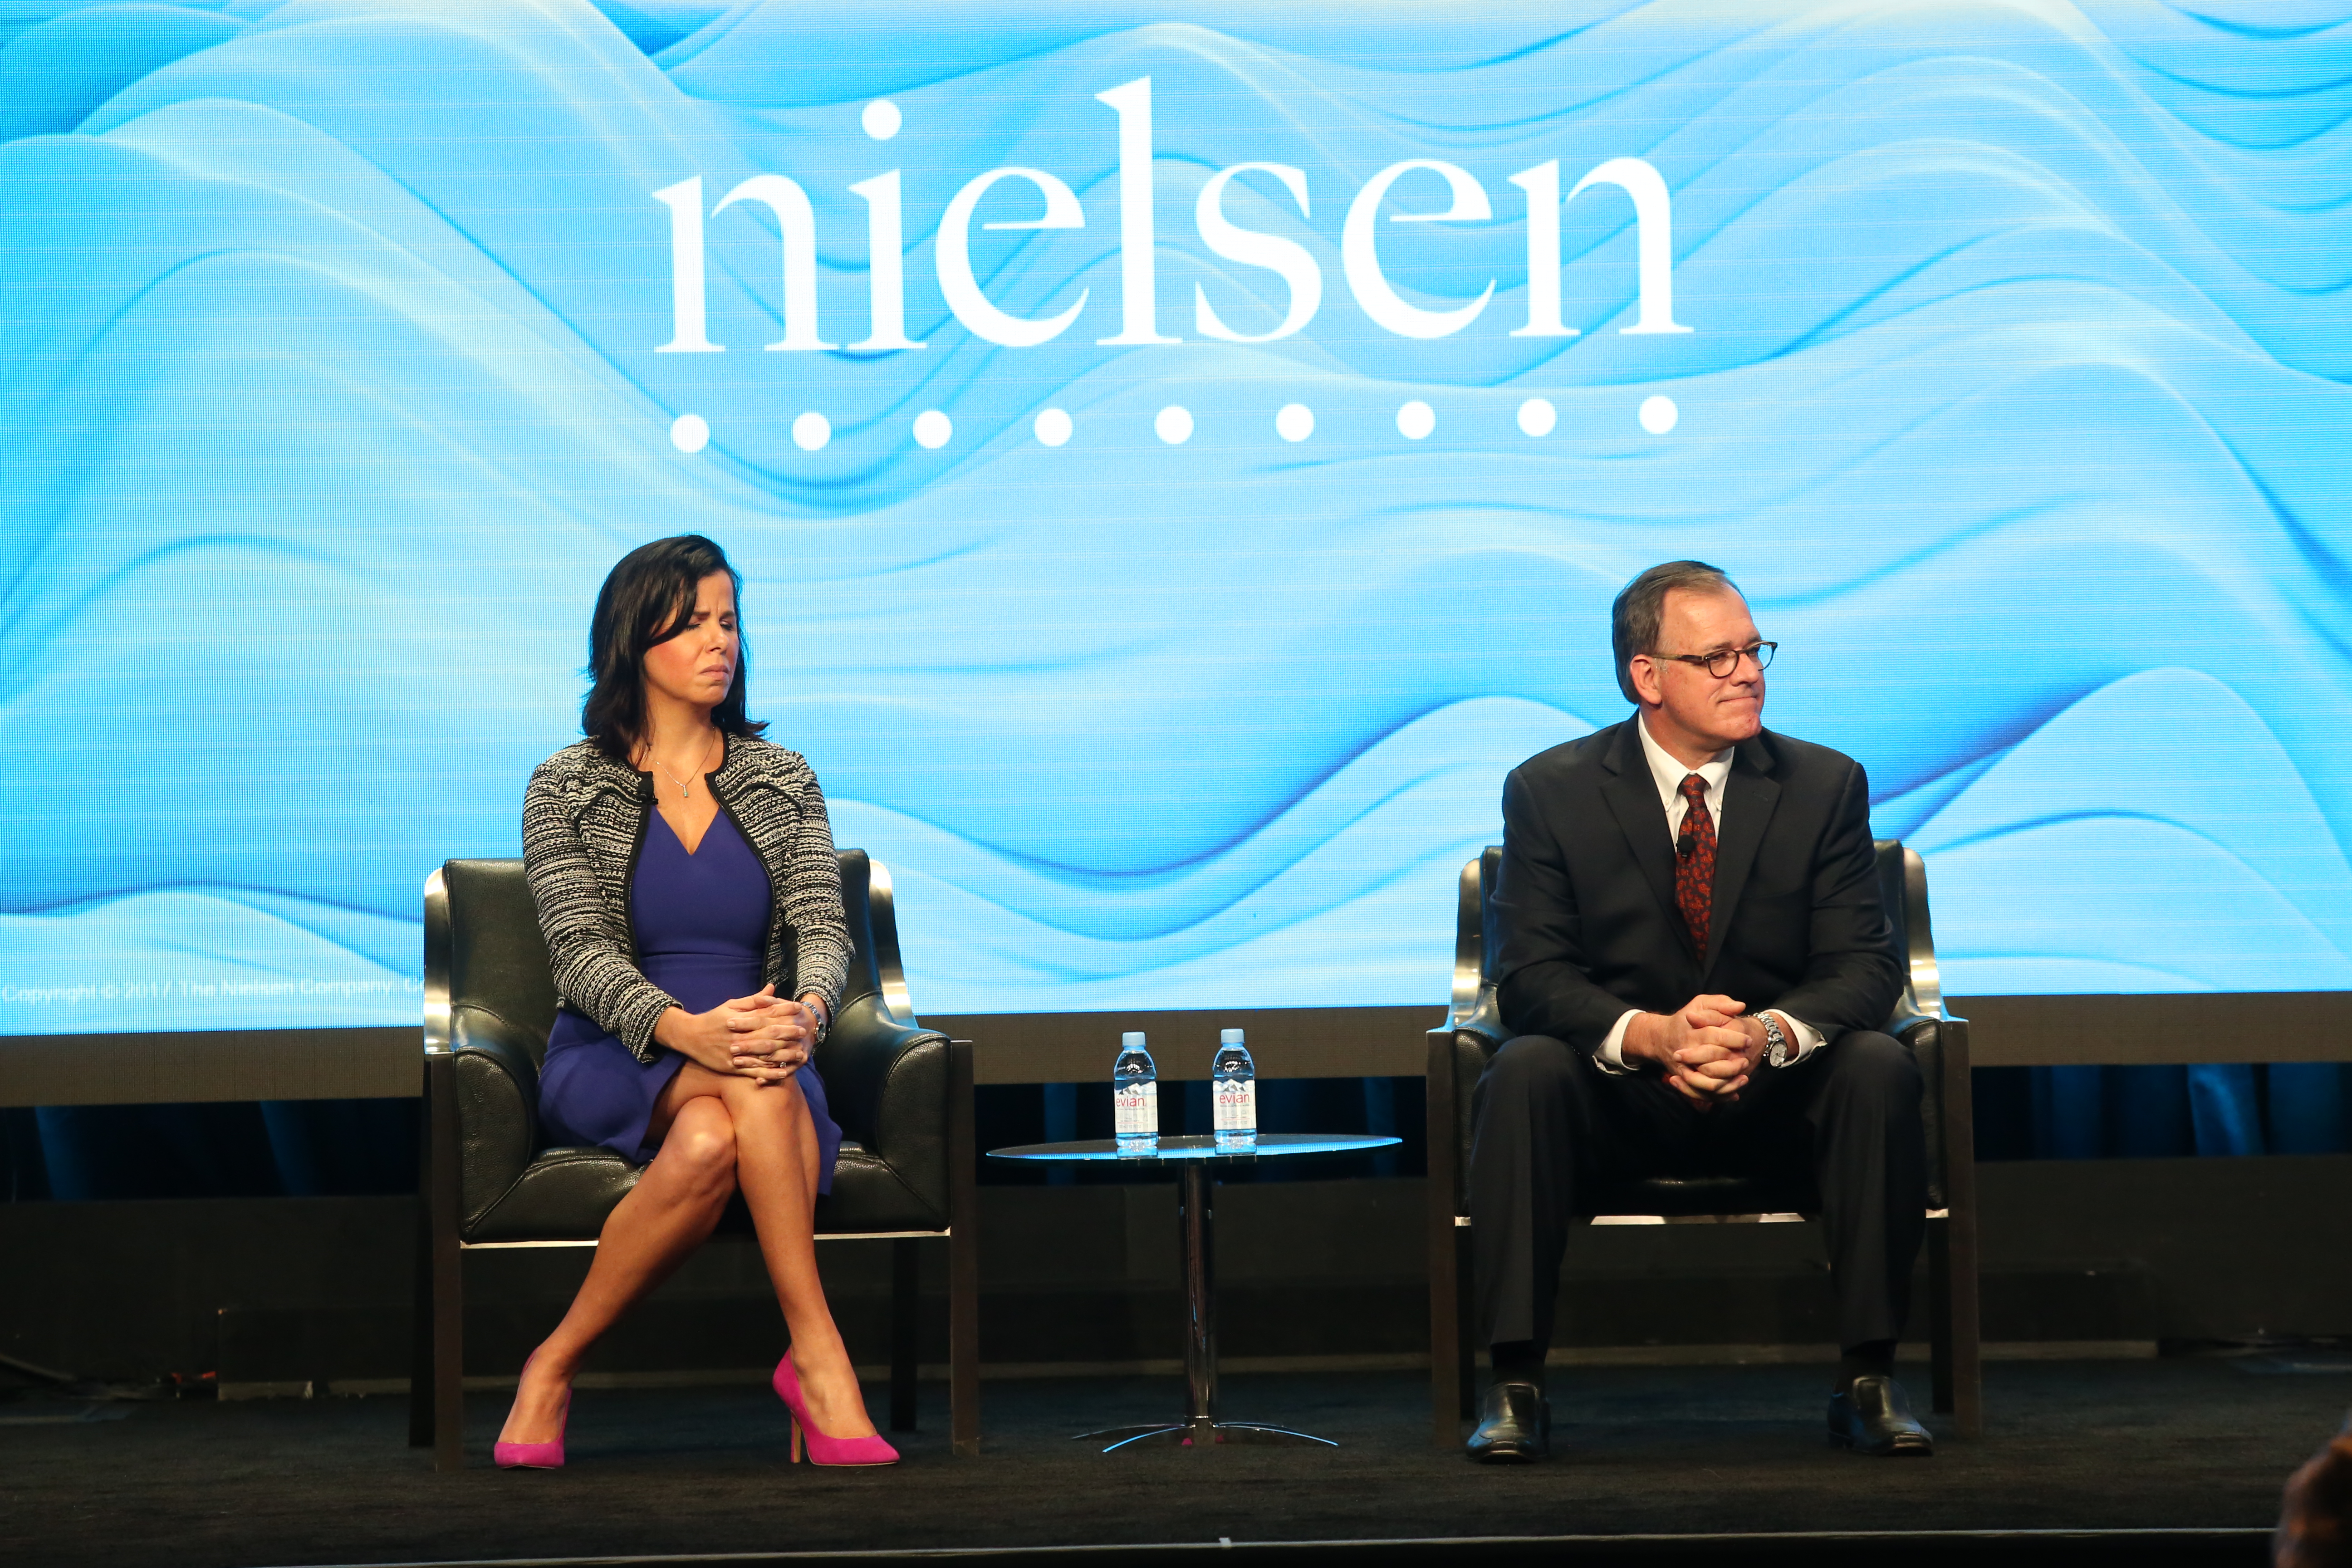
Two executives from Nielsen, Senior Vice Presidents of Product Leadership Brian Fuhrer and Kelly Abcarian (pictured above), explained how Nielsen is handling the challenges of tracking audiences at a time when technology is continuously expanding and evolving and working with clients on how and where to best place their content. Their presentation was thorough if dizzying at times, but full of examples as to how various Nielsen clients from Turner to ESPN to CBS are using data from its Total Audience initiative.
Abcarian told critics how the TNT drama Good Behavior benefited from extended audience measurement over its first 10 episodes. “They’re seeing incredible lift from their Video on Demand audience, on average about 28%,” she said. “What’s interesting for Turner is that this is bringing that younger audience.” Research shows that the median age of the VOD audience is around 49, and it’s a more affluent audience with the median income around $82,000. “This is very attractive to advertisers,” Abcarian said.
Fuhrer delved into the growing area of over-the-top (OTT) measurement. “Over the top is a very generic term that can mean a lot of things to a lot of people,” he said. “The bottom line is it’s a way to get the Internet streaming video to your television set … whether it’s Internet-enabled game consoles, smart televisions or [such] multimedia devices [as] Roku, Apple TV and so forth. At this point, 62% of TVs in households in the U.S. have the ability to do that. So it’s blown past DVRs, all the other types of things that are happening. Seventy-three million homes out there have the capability to stream. This is one of the things that we’re working on with our clients so they understand what’s happening.
“We have a device called a streaming meter in addition to our traditional metering capabilities that we’re rolling out,” Fuhrer later explained. “It tracks, in addition to all the television viewing and all the characteristics about the homes that we put together, the actual streaming that people are using to the television. This is a subset that we’re continuing to roll out, but as we look at homes in the subset that have over-the-top capabilities, 13% of the total time they’re spending on the television is streaming. That’s a pretty astounding figure when you think about it. Again, this isn’t everybody. These are people in streaming homes, if you will. Thirteen percent of their television experience across all the demographics is streaming. We take it to another layer, and we break it down by specific provider.
“The one thing that’s been pretty consistent that we’ve seen [is] about half of the time spent streaming to the TV is Netflix,” he noted. “It’s a huge amount of time that equates to about 6 ½-7% of total television time is using Netflix. We’re continuing to expand, but I think these insights are pretty interesting.”
Abcarian spoke at length about Nielsen’s advances in out-of-home (OOH) measurement, especially as it concerns sports programming, using ESPN as a specific example. “As consumers’ choices have continued to proliferate, [outlets] like ESPN are trying to ensure that they’re continuing to bring those viewers into their programming,” she explained. “So OOH has enabled ESPN to expand and deliver against that same core audience, but deliver even higher numbers when it comes to those audiences through out of home.
“When we looked across January and February of this year, we saw that the ESPN audiences grew by more than 9% with OOH measurement,” she continued. “But that lift is kind of genericized across all of the programming that ESPN would run. When we then [looked] at the highest OOH lifts across their programming, College Football Live was an extremely large audience lift at 19%; NFL Live at 17%; NFL Insiders at 17%, and even regular season college basketball at a 12% audience. This is not the playoffs; this is not March Madness; this is the regular college basketball season still seeing an incredible lift at 12%, and then, as well, the NBA regular season delivering that amazing lift, even before the playoffs began.” Abcarian added that 36% of that OOH audience increase is female.
Admitting it was the most basic of questions, one critic humbly asked, “Who is actually able to sell 8-35 days afterwards? It’s good information to have, but if no one is making money off of it, what is the use of the information?”
“From a Nielsen perspective, what we are trying to do is just empower our clients with the ability to decide whatever kind of deal that they want to make,” Fuhrer replied. “So 8-35 isn’t just a custom report. It’s flowing through all of the transaction systems and the files that they need to make deals. A great quote from one of our clients was, ‘Do you know what? Even if I don’t necessarily change the definition of ‘currency’ yet, at least this allows me to show people what they are getting for free.’ So it starts to open it up. I suspect that we are going to see, when you look at the additional audience out there, people starting to entertain at least a 14-day window.”
The critics pressed on. “So how close are we to seeing an actual total measurement rating point that is going to tell the advertiser how many people they are reaching across all of these platforms that they buy on a show, [a number that] goes through that entire viewing process and all of the people that they’ve reached who have seen the commercial?” one said.
“Examples are starting to flow out now because our clients are seeing them in a lot of cases themselves for their own content,” Fuhrer noted. “This is a very charged situation. The evolution of currency has a lot of different agendas.”
The “one number” thing was a sticking point. “Is there ever going to be just a number or a currency that everybody is going to be able to understand that you have these shows, and this is how many people are watching them across the different platforms, and you can see it in one number?” a critic asked.
“Part of the challenge there [is that] all of the different platforms may have different advertising loads,” Fuhrer explained. “So the idea of total content ratings is just that, being able to add across all the different platforms, and clients are seeing that today. The second part of your question is, ‘Is it a currency?’ That’s part of the challenge of how to put different ad loads together, and we are working with the industry on how they might like to forward that. In some cases, it’s out there today, but it’s going to be a continuously evolving story.
“We’ve been working with our clients over a number of years, and as you think about the proliferation of content and new platforms that are emerging, sometimes it seems like by the second, the questions our clients are also wrestling with are, ‘When is total?’ and ‘How do I ensure that it’s capturing that true measurement of my audience?’ We’ve made great traction against that total definition and showing the flexibility and the capabilities to stay ahead, as much as anyone can stay ahead of a very changing environment.”
Photo provided by Nielsen. Photo Credit: Frederick Brown of Getty.
Click on the social media tiles above or below to share this content with your friends and colleagues.
The opinions and points of view expressed in this commentary are exclusively those of the author and/or subject(s) and do not necessarily represent the views of MediaVillage.com/MyersBizNet, Inc. management or associated bloggers.

Ed Martin
Ed Martin is the chief television and content critic for MediaVillage. He has written about television and internet programming for several Myers publications since 2000, including The Myers Report, The Myers Programming Report, MediaBizBloggers a…