Nonresponse bias seems to be easy to forget. No matter how many times research scientists attempt to teach about this bias, it doesn’t seem to stick in anyone’s memory. That’s why after the recent election -- and after all elections to some extent -- news journalists wrote thousands of words about “Why were the polls so off?” As if survey research is always perfectly accurate except when we can check it against reality in some way, as in election vote counting.
This is a case where we all agree that the big data overrules the small sample size data.
Not so strangely, the big players in small sample research want to go the other way and have the small sample size data overrule the big data. “Because it is a probability sample and therefore more representative of the whole population, of all types of people, than any big data,” they say.
For many decades they have been able to convince practically everyone of this, including me. That is, until I conducted an impartial nonresponse study of my own. The study was published in the peer reviewed Journal of Advertising Research.
The big research companies that rely upon small samples (defined in my mind as fewer than a million intab households or persons) of course have done nonresponse studies of their own -- mostly a long time ago but some more recently -- and the averages they present seem to say that there’s no big problem there.
That’s not what my study showed. Of course, my study didn’t just look at averages, it also looked at specific channels and program types. That’s where the differences were glaring between Research Cooperators and Research Non-Cooperators.
The study used telephone coincidental, which had been the standard of truth at the time. Two weeks later about 80% of the coincidental responders were re-interviewed and asked if they’d like to join a meter panel. About half of them agreed. This is in line with Nielsen’s initial cooperation rate, which declines later in the process as people drop out before and after meters are installed. MRC reports that the typical Nielsen national peoplemeter report is based on an intab response rate against the original predesignated probability sample of about three in 10 homes.
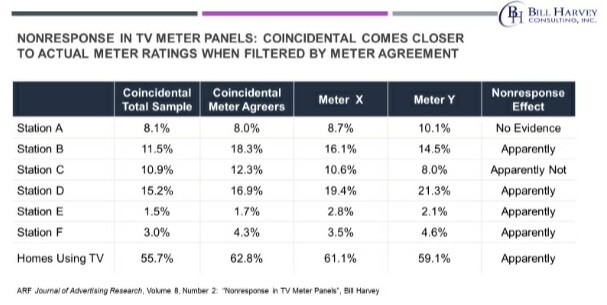
We had the ability from the re-interview to break out the coincidental TV ratings for those who said they would take a meter versus those who said they would not take a meter. The study was done in the New York City Metro Area, which at the time was measured by two television meter panels, Nielsen and Arbitron.
The coincidental ratings for the Meter Agreers looked a lot like the ratings from the two-meter panels ... but not so much like the coincidental ratings for the whole coincidental-measured population. In five out of seven cases (six station comparisons, and the Homes Using Television) the Meter Agreer ratings moved away from the total coincidental ratings, toward the ratings in the two-meter panels.
You see, at the time, the refusal rate for Coincidentals was only 5%. Coincidentals had almost no nonresponse bias. They only had 5% nonresponse, whereas today’s best meter panels around the world have upwards of 70% nonresponse bias.
The nonresponse in polls is generally worse than that.
Note that there are psychological differences between Research Cooperators and Research Non-Cooperators which became visible in this study. Although Nielsen and Arbitron used different specific techniques of metering, data editing, data coding and data tabulation, the two-meter panels agreed very closely with one another when we indexed meter program type average ratings to the coincidental truth standard.