Sensory Media Allocation = Video Deprivation

Since 1948, when commercial television was born, media pups were taught in their first week in the business about different media coming through different sensory channels: TV (Sight, Sound and Motion), Print (Sight), Outdoor (Sight) and Radio (Sound).
At Grey, like every other agency, we believed in the power of television because of the Sight, Sound and Motion notion. It seemed obvious that attention and emotions are much more easily captivated when both eyes and ears are engaged rather than just one or the other.
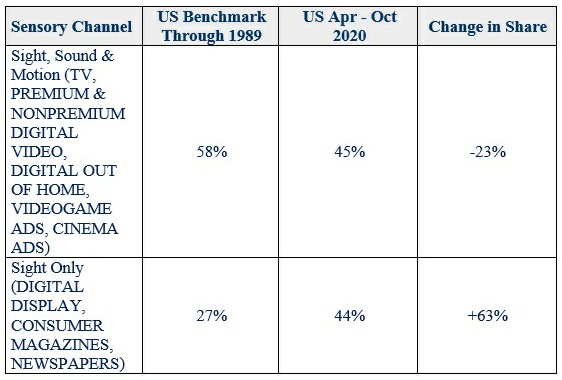
I estimate that until around 1989 (the year Timothy Berners-Lee launched the World Wide Web) we big agencies spent around 58% of our clients’ money in TV, about 27% in Sight-only media Print and Outdoor, and the remaining 15% or so in the Sound-only medium of Radio. (I’m hoping Ed Papazian will sharpen that estimate in an appended comment.)
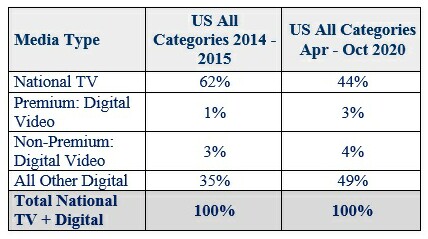
As I was writing my December 10 post my mind connected some dots it had never connected before, and I observed how most of the money in Digital today is Sight-only, i.e. display ads. This kind of surprised me, given that Digital Video has now been available for well over a decade, and appears, compared to its own prior baseline, to be booming today. Yet U.S. ad spend in Digital Video is dwarfed by Digital Display 7 to 1 across all SMI product/service categories combined in the period April-October 2020 in which Digital Video is at its record highs in history.
This reflects the biggest advertisers, the ones that use the major holding company and largest independent media agencies. (My estimates for 1989 above cover the same major advertiser/agency universe.) Here are the data for all product/service categories combined:
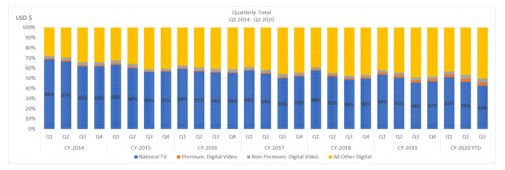
Another view is presented by the following bar chart. Note how the two Digital Video slices in the middle (which you have to really peer at to even see) do not grow even slightly for a very long time and then very recently start to grow but very slowly, and more at the expense of TV than at the expense of Digital Display, which strangely still continues to grow far more than the Digital Video types.
Here's what James Fennessy, CEO of Standard Media Index (SMI), has to say about it: “Our data shows video advertising to be underutilized, specifically premium video where streaming options can provide strong ROI to marketers. While ad spend on OTT has shown some growth of late, it is still a very small share of total investment.”
I agree. CPM is the probable reason for it, CPM without regard to ROI.
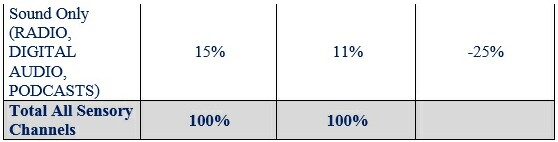
Here are my own estimates based on PwC, SMI and other sources, when we lay side by side today’s Sensory Media Allocation here is what we see:
My question to all of us is, do we now all believe that what we were taught about Sight, Sound and Motion was a mistake, and we now all believe that static, small-space print-type ads on screens are the equal of Sight, Sound and Motion, or did this pattern sneak up on us, and maybe should be questioned as to maximum cost effectiveness?
Again, the pattern has all the earmarks of being the result of fixation on low CPMs with blinders on as regards all other considerations.
What are those other considerations, then? ROI is one healthy consideration, especially because it automatically integrates CPM. If a media type has high enough CPM, its ROI will not look good even if it has more upward sales impact. So, ROI already covers all your concerns about CPM, plus, it values sales more than impressions, which is good thinking.
From an ROI point of view, the BHC FOX SMI study shows that premium Digital Video has the highest ROAS, TV is second, non-premium Digital Video is third, and Digital Display is fourth-ranked in ROAS.
However, unless you use random control trials such as the ARF is offering with Central Control, BHC and 605, we know that measurers and modelers of ROI often appear to be getting different answers. So, not content to rely on one study alone, I asked my friend Leslie Wood, Chief Research Officer of NCSolutions, for the latest ROI meta-analysis norms by media type, based on over a thousand studies mostly focused on CPG. I find the results extremely interesting and I think you will, too.
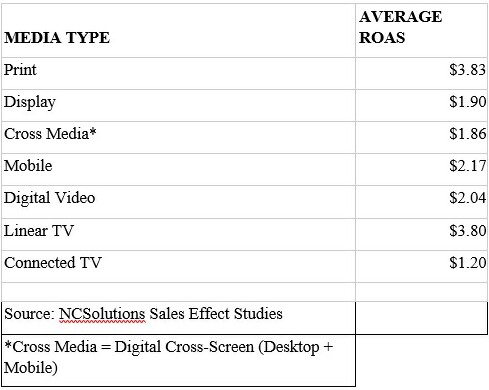
Leslie Wood comments: “The price of media is a central component to measuring return on advertising spend (ROAS), and the impact varies greatly across media. This means that in the advertising world, both supply and demand ultimately drive costs. Print has a secondary readership or pass-along readership that is often not considered in the cost of the media by some marketers and this increases the number of consumers exposed to the advertising. Connected TV is more expensive but might reach a more desirable audience segment for a given brand. The ROAS metric is one of many factors used to measure overall campaign effectiveness.”
Both the national time series BHC study and the single source NCS study -- vastly different methods -- agree that within the field of choices we have been discussing (TV, premium and non-premium Digital Video, and Digital Display), (1) TV definitely is near the top, and (2) Digital Display is half the ROI of TV.
What about Digital Video? Well, the jury is still out, because SMI is able to break records out by premium vs. non-premium Digital Video, and the BHC study finds premium Digital Video higher than TV -- and so might NCS if they did that recategorizing. If the BHC study lumped premium and nonpremium together we might come up with similar number to NCS, because, frankly the nonpremium ROIs were so low (and a larger weight of ad spend) that they would probably lower the average for all Digital Video to be in line with this NCS chart.
What I find especially interesting is that Print comes up a hair over TV. Earlier studies going back to the famous MPA matched market tests showed the two media having equal impact, and synergy together. Those print ads were just one sense, Sight, but in the field of major magazines the ads tended to be full-page, four-color bleed -- powerful, gorgeous, and arresting. The context of reading a magazine tends to be leisurely and relaxed and the audience is in total control, unlike electronic media which maintains considerable control over timing, etc.
That same sense, Sight -- in the context of digital in which the audience wants to be in total control and is subconsciously put off by the fact that the medium has a lot of control -- using small space ads that magazines run only in the back of the book and not for the major advertisers, has a completely depleted effect compared to consumer magazines.
Conclusion: Based on the evidence at hand, TV should not be losing share to Digital Display, and yet it is. I propose that the TV networks pay the cost of the ARF RCT-21 for as many advertisers who want a free test, and then we’ll all know.
Click the social buttons above or below to share this content with your friends and colleagues.
The opinions and points of view expressed in this content are exclusively the views of the author and/or subject(s) and do not necessarily represent the views of MediaVillage.com/MyersBizNet, Inc. management or associated writers.

Bill Harvey
Bill Harvey, who won an Emmy® Award in 2022 for his invention of set top box data, has spent over 35 years leading the way in media research with pioneer thinking in New Media, set top box data, optimizers, measurement standards, privacy standards, the A…