The Current State of Paid Tune-In
In my post of April 10, 2023, Tune-In Is More Important Now Than Ever Before, I shared my thoughts on how we could be getting more rating lift per dollar by out-of-box thinking, specifically by targeting people who are prospects for a series even though they may not yet even be aware it exists. The article lays out the recommended method in detail. In re-reading it and becoming re-energized to break through old thinking about tune-in, I decided to write this article, which analyzes where tune-in ad spend is placed today. In collecting these facts we're indebted to Standard Media Index, the only company which obtains actual ad spend data directly from agency computers, who agreed to share the data you will see in this article.
The title of today's article refers to "paid" tune-in. Just to remind readers that generally the bulk of the GRPs delivered by tune-in are on the network group's own air -- and only in the last ten years or so has paid tune-in become significant -- currently estimated to be well over a billion dollars a year. That's on top of an estimated $14 billion that the networks give up by allocating about a fifth of their saleable ad inventory to self-promotion ("own air tune-in").
Almost eight years ago I wrote a column titled Not Your Father’s Tune-In in which I interviewed Charlie Fiordalis, then the Chief Digital Officer of Media Storm, a leading tune-in agency. In that interview Charlie said that "networks are tiptoeing into digital with an equilibrium point of about 15-20%" of the paid tune-in budget.
Today, digital has become more than half the network TV paid tune-in budget across the industry in the U.S.
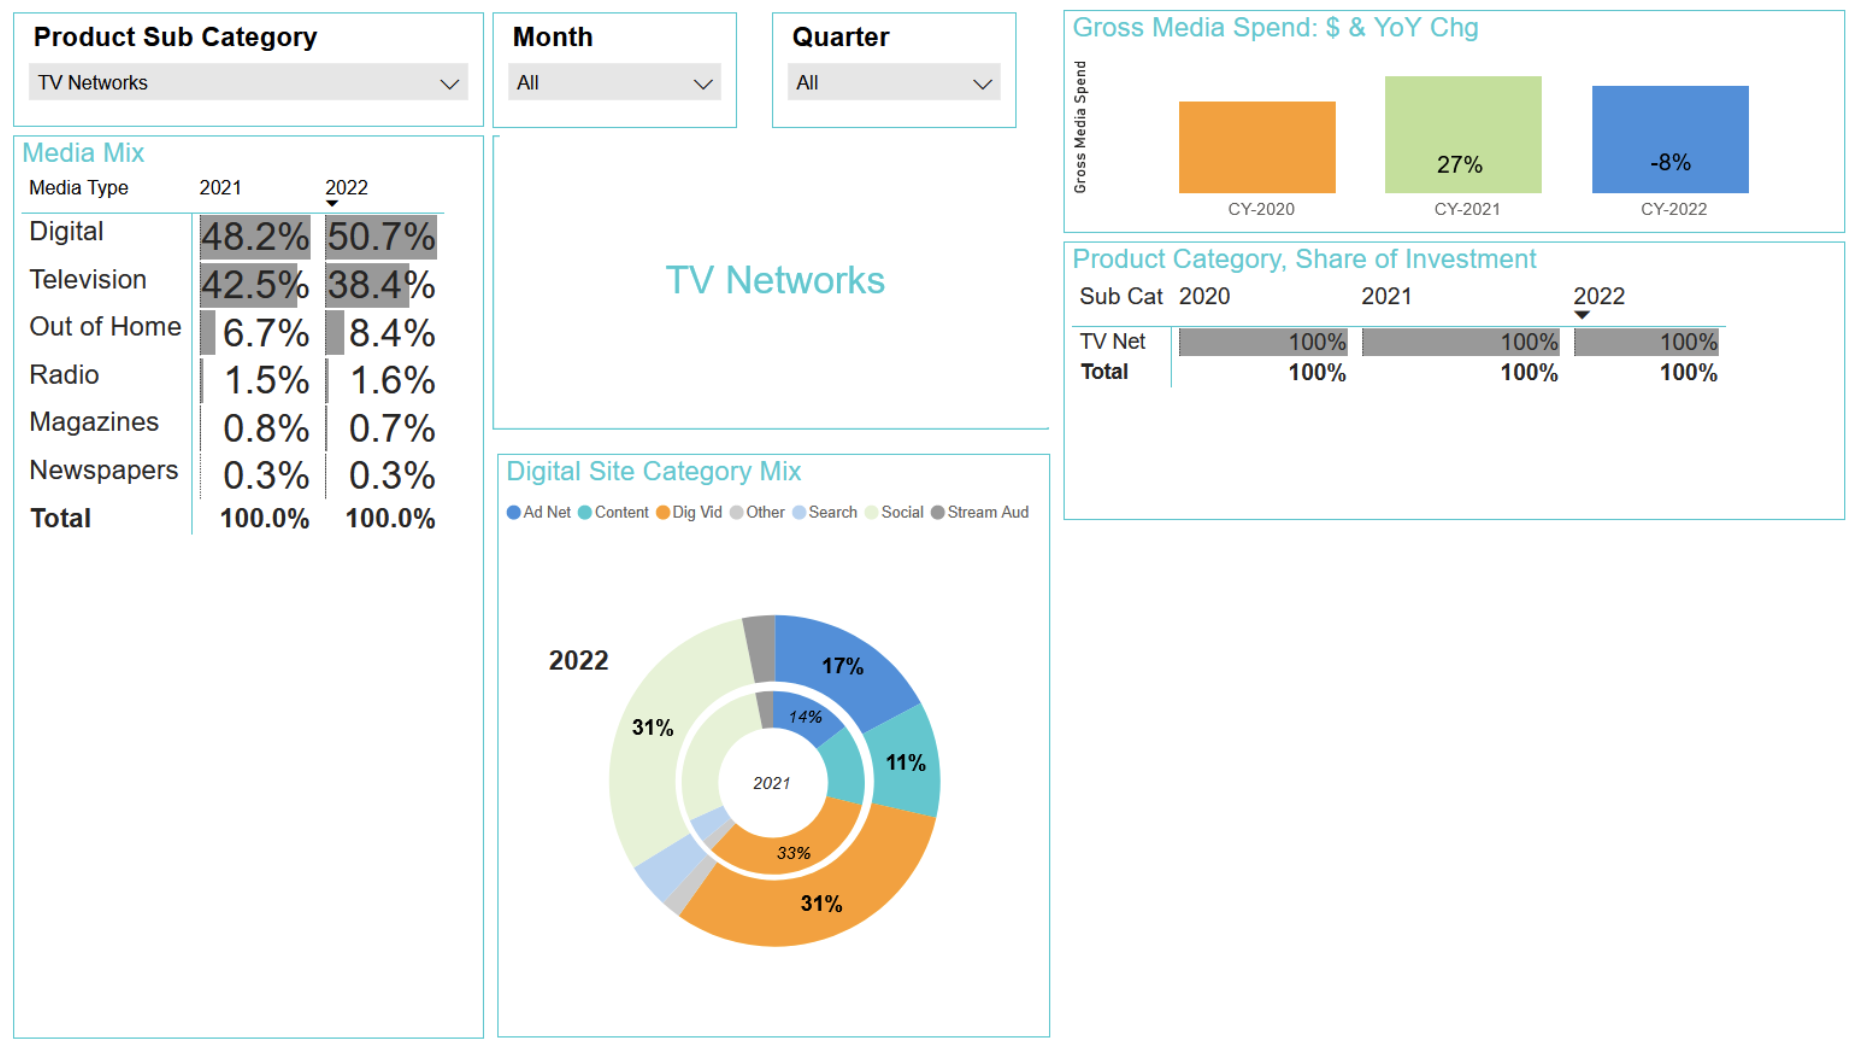
One’s natural first reaction to this is, how ironic that TV networks are going to extremes to prove the immersive emotive power of their contexts (even though it is obvious), yet they themselves when they pay real money to buy media, they put 50.7% of it in digital, 38.4% of it in TV, 8.4% of it into out-of-home, 1.6% into radio, 0.7% of it into magazines and 0.3% of it into newspapers.
However, as is often the case, first reactions are misleading: because of all the "one's own air" tune-in, there is already a ton of TV being used before they start spending actual cash.
One can argue about the specific percentages that would be optimal for tune-in, but on the face of it the use of all of these media types makes eminent sense. The more different media types that are used, the more different ways the advertising is being experienced and integrated into longterm memories and predispositions to action. This was taught by Larry Deckinger more than half a century ago, and proven by an ARF meta-analysis of about 5000 market mix modeling (MMM) studies eight years ago.
We observe that total ad spend on tune-in in the U.S. increased +27% year-over-year in 2021 -- but then dropped back -8% in 2022. As expressed in my April 10 post, this is not the time to be cutting back on tune-in spend: quite the opposite. Tune-in spend is the "military force" that protects the $230 billion business investment in the content. It is already too small at less than half a percent for the "insurance" covering the investment. Double it or triple it -- but do not cut it back! That would be pennywise and pound foolish. Like going for a lower CPM and a lower ROI, but of course, the industry does that religiously.
When we look closely at the numbers below, we see that from 2021 to 2022 digital, out-of-home and radio increased, while TV and magazines decreased. Was this based on measuring real rating lift results? How accurately were those measurements taken upon which these shifts were based? If, for example, it was based solely on smart TV data, or MMM, or other non-bulletproof methods, were the decisions well founded? At this historically significant moment in time, TV network chiefs need to make decisions based only on the hardest facts. Cutting costs of research for decisions like these is again pennywise and pound foolish. Like cutting costs on your cancer doctor.
The allocation to digital subtypes is very interesting: two-thirds of the digital dollars go to digital video and to social. Social increased its share from 2021 to 2022, while digital video decreased its share by a similar amount. Again, what was the strength of the research which led to those shifts?
We also note an increase in share for content 2021 to 2022, which makes a lot of sense. Owned media tend to have greater positive behavioral impact than paid media.
The use of ad networks is also increasing. This is possibly due to practitioners discovering the trick we recommended testing in our April 10 article of using display to get users to click to see trailer.
Paid search appears to be allocated an appropriately small share, since organic search for TV shows is one of the largest types of organic search. This reflects the inadequacy of current program recommenders. A better alternative is here.
Lowballing the estimate of total digital spend on U.S. tune-in in 2022 at a minimum of $500 million, nearly $400 million of which is outbound and addressable, therefore its efficacy could be almost doubled by use of RMT Semasio advanced audiences which are based on deterministic content consumption by individuals, without lookalikes.
We also looked at Pathmatics data in order to get a better idea of which digital video platforms the TV networks are using. The TV networks appear to be maximizing reach by using many different digital video platforms, both premium and non-premium, again very sensibly given how much premium they are using via "own air" and paid.
Today the main method of selecting other TV shows on other networks in which to place ads for your own TV shows is based on audience duplication. The rule is to pick shows that overlap their audiences as much as possible with your show. This idea works but has flaws:
- It only works within the 30% of the U.S. population that is already aware of your show, and ignores the other 70%.
- Duplication is determined mostly by audience size, meaning that this strategy tends to put you in the high-rated shows which have the highest CPMs.
Better to base tune-in media selection on the duplication of memes, rather than the duplication of audiences, which means using RMT -- which has the most scientific and proven method of identifying the memes in every television show, website, app, magazine, newspaper, etc. In this way you can find shows on other networks that may have as high as 70% meme duplication with your show being advertised. The current audience duplication method picks shows whose audience duplication may seem high by comparison to the average, but the actual level of duplication will tend to be under 10%.
Takeaways:
- Don’t scrimp on research measurement accuracy for decisions that impact the existential future of your network.
- Test RMT advanced audiences for tune-in and measure the results by the most accurate means available.
Posted at MediaVillage through the Thought Leadership self-publishing platform.
Click the social buttons to share this story with colleagues and friends.
The opinions expressed here are the author's views and do not necessarily represent the views of MediaVillage.com/MyersBizNet.

Bill Harvey
Bill Harvey, who won an Emmy® Award in 2022 for his invention of set top box data, has spent over 35 years leading the way in media research with pioneer thinking in New Media, set top box data, optimizers, measurement standards, privacy standards, the A…